
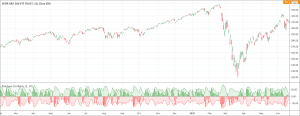
- The Rainbow Oscillator is a trend following indicator.
- It uses multiple moving averages to hint for trend reversal.
The Rainbow Oscillator indicator helps to predict the changes in the market trend and to follow trends. It offers only two possible states, the upward and the downward. Mel Widner developed the Rainbow Oscillator and published it in 1997 in the Technical Analysis of Stocks and Commodities magazine.
The Rainbow Oscillator is based on the Rainbow charts trend and is just like the Rainbow Moving Average charts. It works on the basis of a two-period moving average and its graph also helps to identify the highest high value and the lowest low value among moving averages.
How does the Rainbow Oscillator work?
The Rainbow Oscillator is a simple indicator used to forecast trend reversal. It is a simple yet very important technical analysis tool. The oscillator works on the same rules as does the Rainbow indicator. It uses two simple moving averages, HHV and LLV. The Rainbow Oscillator creates an oscillator with bandwidth lines.
What does the Rainbow Oscillator tell traders?
As the entire forex trading world knows that the stock market movements follow specific trends and are not random or chaotic. Several tools have been tried and tested in the light of this discovery. The Rainbow Oscillator is also one of those technical analysis tools. Although it is a relatively new indicator but has become very popular for effectively forecasting the changes in the trend direction.
The Rainbow Oscillator appears as a director of the trend as it follows the ups and downs of the market. The growing width of the Rainbow indicates that the current trend is likely to continue. The values of the Rainbow Oscillator beyond 80 suggest an unstable market and prone to a sudden reversal of the current market trend. On the other hand, when the prices move to the Rainbow and the Rainbow Oscillator begins to become flat, it indicates that the market is stable and the bandwidth decreases. The Rainbow Oscillator values falling below 20 again indicate an unstable market and also prone to a sudden reversal of the current trend in the market.
Important rules for the indicator
In simple words, we can derive the following rules.
- The Rainbow Oscillator’s wider width suggests a continuation of the current trend.
- The Rainbow Oscillator between -50 and +50 indicates a stable trend.
- When traveling beyond 80, the Rainbow Oscillator suggests an unstable market and a possible reversal of the current trend.
- The Rainbow Oscillator traveling below 20 also indicates instability and a potential reversal of the current market trend.