
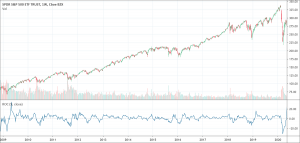
- The Rate of Change (RoC) indicator is an unbounded momentum oscillator.
- Three main states are possible:
- A rising RoC above zero typically confirms an uptrend
- A falling RoC below zero indicates a downtrend
- A RoC hovering near zero hints for consolidation
What is the ROC indicator and how to calculate it?
The Rate of Change indicator is a momentum oscillator. Traders use it in their technical analysis tool belt. It calculates the change in price percentage of a financial asset between periods. The indicator calculates the change percentage by taking the current price and comparing it to a price “n” periods ago. It has the following formula:
ROC= [(CURRENT PRICE / PRICE OF n PERIOD AGO)- 1] * 100
Where n is the time period
After that, it plots the percentage change value that begins to fluctuate above and below a Zero Line. The earlier price can be any price n periods ago but generally 14 trading days earlier price is selected. It is important to note that the rate of change simply represents the difference between the current and earlier price even if the difference in prices isn’t occurring from day to day. Momentum will be zero when there is no difference between both prices. Similarly, it will be negative when the earlier price is higher than the current price.
Traders use it to identify divergences on charts, conditions regarding overselling or overbuying, a reversal in trends, or confirmation of the trend. Many technical analysts and experts also use it as a leading indicator to identify the extreme value of the price that will finally go back to the mean value. Traders usually really like it and rate it high compared to other indicators. However, it also has certain drawbacks traders must consider before initiating a trade on the basis of the Rate of Change indicator.
How the Rate of Change indicator works?
The Rate of Change indicator works on the basis of a simple formula. Its calculations of the Rate of Change are also simple with only three variables in the formula. Being a non-banded oscillator, it tracks the changing trends in the market if the trend speed is increasing, decreasing, or maintaining the momentum. It simply tracks the closing prices of two periods. The period is set by default to 12 days. It identifies the closing price of 12 days back and subtracts it from the current closing price. Afterward, it plots or accepts the difference as the Rate of Change (ROC). It can also give this rate in terms of percentage. Rate of Change can be both, a positive or a negative figure. The Zero Line is finally used as a reference.
What does the Rate of Change indicator tell traders?
The Rate of Change indicator is a momentum oscillator and its prices oscillate below and above the Zero Line. During a very strong uptrend, its price calculation shows readings that increase over an extended period of time. The reason behind this is it has no boundaries. Moreover, its value depends on the actual price of the trading assets, it is common that its calculations continue to expand to higher levels during the time span of a specific period. It also shows both positive and negative values.
Positive values indicate an uptrend while negative values show a downtrend in the trading market.
Its interpretation is also easy:
- When the ROC is above the Zero Line and constantly rising above, it indicates an uptrend and its speed is accelerating
- ROC is descending and is above the Zero Line, it indicates that the speed of the downtrend is decreasing
- When the ROC is above the Zero Line, again begins to rise, and crosses the previous highest point, it indicates that uptrend is accelerating speedily
On the other hand:
- When the ROC is below the Zero Line and it is descending further lower, it shows that the downtrend is accelerating
- ROC begins to ascend and is below the Zero Line, it means the downtrend is decelerating
- When the ROC is below the Zero Line and again begins to descend, it means the downtrend is again catching speed
How to use the Rate of Change indicator?
The Rate of Change indicator can be used to detect price divergences, confirm price movements, or track overselling or overbuying conditions. It is interesting to note that the Rate of Change indicator works well with all markets. It has no right or wrong setting. However, it is a must for every trader to make decisions by observing the volatility of the financial market and overall market conditions.
The Rate of Change indicator is flexible with various timeframes such as 10 minutes, 2 hours, daily, 2 days, or weekly. It is simple as well as fast to calculate the values. Due to its flexibility, it can be used from short-term trading to financial analysis of any kind of financial asset. However, it is the best practice that its calculations should be used for long-term trend identification. Technical analysts and experts emphasize that it should be used for confirmation signals. Moreover, it is one of the best trading indicators that can be used to measure the strength of a trend.
Pros and cons of the Rate of Change indicator
The Rate of Change indicator is one of the most efficient and effective indicators for the traders. It has numerous advantages. However, like all other indicators, it also has certain limitations to take into account before entering a trade.
Pros
- Being a non-banded oscillator, it is efficient in tracking the changing trends in the market
- Being a momentum oscillator, it has the ability to reveal significant information about the strength of a current trend in the market.
- It can detect market conditions such as overbought or oversold with precision
- It also can spot divergences occurring in the trading market
- Traders can use it to confirm the continuation of a current trend
- It gives an early warning of a potential change in trend with its centerline crossovers
Cons
- It gives equal weight in calculations to the current price and price periods ago. It is the main drawback of the Rate of Change indicator because previous prices may not be relevant anymore. That is the reason that several other indicators such as Exponential Moving Averages (EMA) assign more value to the most recent prices.
- The Rate of Change indicator may give false signals because it cannot neglect whipsaws. This situation escalates when the reading stays near the Zero Line for a significant time. This happens because price consolidation makes price change shrink and hence the indicator moves to zero. This situation gives multiple false signals without confirming the consolidation.
- It is imperative to use the Rate of Change indicator in a proper way. Otherwise, signals may prove costly for the traders.
Conclusion
The Rate of Change indicator is the simplest of indicators but it is among one of the most useful technical indicators. It is a momentum indicator that is widely used in momentum or trend investment. The ROC indicator detects trend changes and the strength of a trend diligently. It can measure the speed of price changes effectively. An upward movement suggests a speedy increase in price while the downward surge indicates a speedy decrease in price. Traders also use it for confirmation, assessing market conditions, and divergences. However, it is advised by the technical analysts not to use the Rate of Change as a standalone indicator. It is best to use it in conjunction with other technical indicators for better management of your trading strategy. Bollinger Bands, ADX indicator, Moving Averages, etc. are among the most common indicators that can work well with Rate of Change.