
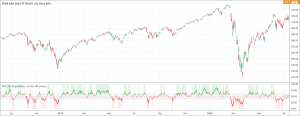
- The Relative Volatility Index (RVI) is a volatility indicator.
- It is best to use it in conjunction with other momentum or trend following indicators to confirm trends.
The Relative Volatility Index (RVI) is a volatility indicator that helps to identify the direction of volatility. Donald Dorsey developed the RVI indicator to calculate the standard deviations of prices during a predefined lookback time period. The RVI is similar to the Relative Strength Index but adds standard deviations based on price direction instead of adding price deviation amounts. The best use of the RVI indicator is to use it in conjunction with other momentum or trend following indicators to confirm trends.
To understand the value of the Relative Volatility Index, it is important to understand what is volatility. It is a measure of the range as well as the speed of change in the price of financial assets. It is important to know about the volatility because it enables you to understand the risk associated with the financial assets of your choice. Knowing volatility in the financial markets becomes more crucial during economic turbulence. Therefore, the volatility indicators are very significant technical analysis tools and the RVI is one of the high-profile volatility indicators.
How to calculate the Relative Volatility Index?
The Relative Volatility Index calculations first employ standard deviations for the daily highs and standard deviations for the daily lows. Then an exponential moving average smoothes the lines. Finally, the Relative Volatility Index indicator calculates the RVI. The following are the possible values for the RVI calculation.
- Open
- Close
- High
- Low
- Adjusted close
- HL2 (High + Low)/2
- HLC3 (High + Low + Close)/3
- HLCC4 (High + Low + Close + Close)/4
- OHLC4 ( Open + High + Low + Close)/4
The formula for the RVI calculation is:
Relative Volatility Index = {The average sum of the STD deviations for positive days / ( The average sum of the STD deviations for positive days + The average sum of the STD deviations for negative days)} × 100
How to interpret and use the RVI?
The Relative Volatility Index is a simple but quite useful technical analysis tool. The RVI wasn’t developed as a standalone indicator rather a confirmation indicator. It tells much useful information to the traders. The RVI values range between 0 and 100 as percentages. The RVI value above 50 indicates upside volatility and a potential buying opportunity. On the other hand, the RVI values below 50 suggest downside volatility and a potential selling opportunity.
The other way to use the Relative Volatility Index is to look for potential entry signals. The RVI value below 40 strongly recommends an entry for short positions. It also issues exit signals when traders are already engaged in trading. The RVI values below 40 indicate to exit the long position while the RVI values going above 60 suggest covering short positions. Moreover, some traders also consider the RVI indicator as a measure of market strength. The reason is volatility drives prices and the RVI can greatly help in the short-term markets. Volatility also has the potential to drive trends and here again, the RVI can provide significant insight into the trading markets.