
- The Schaff Trend Cycle (STC) indicator is an oscillator.
- It helps to identify the market trends with improved speed and accuracy.
The Schaff Trend Cycle (STC) indicator is an oscillator indicator that helps to identify the market trends with improved speed and accuracy. The STC also provides buying and selling signals and pinpoints entry and exit points. It is a combination of stochastic and the moving average convergence/divergence (MACD). As a result of this combination is an STC indicator with an enhanced version of the oscillator indicator that minimizes the choppiness during trends and is more quick and efficient in responding to price actions. You can use the STC indicator easily on TradingView.
What is the STC indicator?
The most interesting thing of the Schaff trend cycle indicator is that it combines leading and lagging indicators. Schaff assumed that the forex trends decelerate and accelerate in cycles. The unique blend of the stochastic and the MACD ensures that the resulting indicator will be more efficient in trend identification. The decreasing values of the STC indicator indicate the falling trend cycle while the prices being stable or may follow the cycle to the downside. On the other hand, the decreasing values of the STC indicator suggest an uptrend while prices being stable or may follow the cycle to the upside. The Schaff trend cycle indicator is popular for a general trading strategy. The strategy suggests buying when it surges above 25 level and sell when the signal lines go below the 75 level.
Doug Schaff invented the STC indicator in the 1990s. Schaff was the president and founder of FX Strategy. The STC indicator is a direct result of Schaff’s vast experience, more than 20 years, in technical analysis, exceptional understanding of the technical analysis and price actions, and trading skills in currencies. Since the release of all the information about the STC in 2008, it has become one of the widely used indicators in the technical analysis. Probably no one could have given this generation of traders and technical analysts a better intriguing and fascinating gift as Schaff did. The STC indicator is surely a masterstroke of a genius with a wealth of experience in his field.
The formula of the Schaff Trend Cycle indicator
The STC indicator uses the following three inputs:
- Short-term exponential moving average with a default period of 23
- Long-term exponential moving average with a default period of 50
- Cycle adjusted at the half of cycle length with a 10 points default value
The formula of the STC indicator is;
Exponential moving average 1 = EMA (Close, short-term)
Exponential moving average 2 = EMA (Close, long-term)
Moving average convergence/divergence = EMA 1 – EMA 2
Now, the MACD value is used for the calculation of 10 period stochastic as follows;
STC = 100 × {MACD – % K (MACD)} / {%D (MACD) – % K (MACD)}
How does the Schaff Trend Cycle indicator works?
The working of the STC indicator revolves around the unique combination of the stochastic and the moving average convergence/divergence (MACD). MACD helps to predict price actions but it has some lagging issues because of its slow responsive signal line. However, the STC indicator doesn’t have any lagging issues. It helps to quickly identify the trends long before the MACD indicator is ever able to identify.
The STC indicator also adds a novel cycle component in the calculations as we have seen in the formula. The STC’s use of cyclic aspect instead of moving averages is also another masterstroke that results in increased accuracy and speed. It is important to note that notion of cycles is extremely important for the global financial markets. The cycle improves the overall accuracy and reliability of the STC. Moreover, it makes it easy to spot positive and negative tendencies in the market.
What does the Schaff Trend Cycle indicator tell traders?
The Schaff trend cycle indicator tells traders about the prevailing trend in the market, buying and selling, overbought and oversold conditions, and pinpoints entry and exit points. It uses two thresholds to convey valuable information. The first threshold is at 25 and the second at 75. The crossing above the 25 line indicates an uptrend while the crossing below the 75 line indicates the downtrend. When the indicator lies between the two thresholds, it indicates that the trend is strengthening in either of the two directions.
The STC indicator can only turn into a straight line when it is in the territory of the uppermost or lowermost points. When the STC indicator’s straight line is above 75 line, it means overbought market condition. On the other hand, if the straight line is below the 25 line, it indicates oversold market conditions. In both of these conditions, there is a strong possibility of a trend reversal, however, the indicator does not provide an exact timeline.
How to trade with the Schaff Trend Cycle indicator?
The STC indicator is a straightforward indicator that is useful for the trading of all types of assets and all timeframes. Technical analysts and experts suggest entering a buying position when the STC goes above the 25 line because of the positive turn. Conversely, when the STC goes below the 75 line, entering a selling position is a prudent strategy. However, the opinions of the technical analysts and experts vary on when to close the deal. The majority of them believe that it is viable to close when the STC indicator turns into a straight line. However, it is crucial to move ahead only if you have confirmation. Experts suggest using other indicators that are similar in function to the STC indicator.
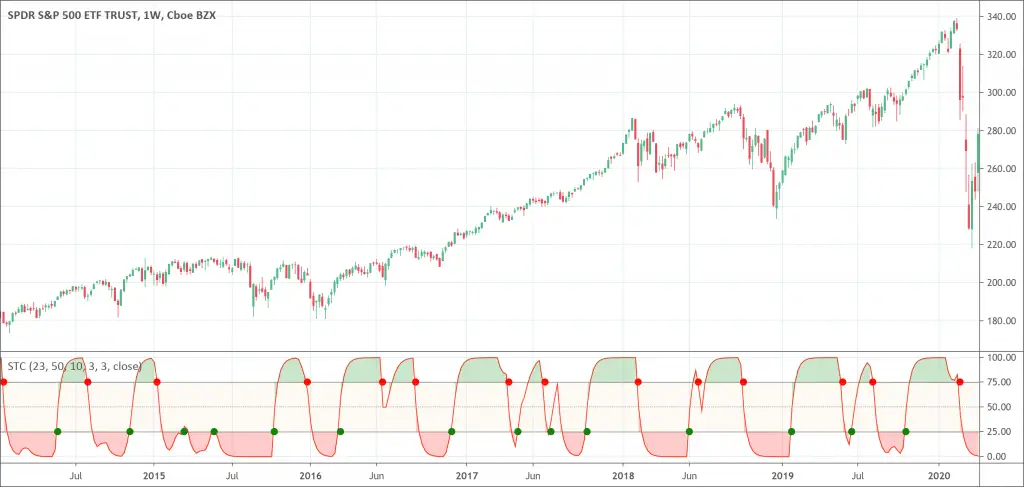
The chart above is from TradingView. Click here to check it out directly and get started on TradingView in a few clicks for free!
Conclusion
The Schaff trend cycle indicator is one of the most reliable indicators. It is quite useful for indicating a change in trend and buying/selling and entry/exit points. The STC also indicates the overbought or oversold market conditions. It is an indicator that suits trading in all types of assets and timeframes. Although the Schaff trend cycle indicator is most a reliable indicator, it has also certain limitations. It faces problems during overbought or oversold extended periods. Therefore, experts always advise using the STC indicator in combination with other similar indicators for confirmation.