
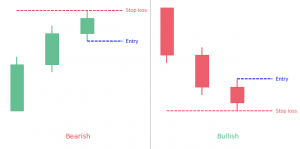
The stalled candlestick pattern is a three-bar pattern that predicts an upcoming reversal of the trend in the market. Although it is usually a bearish reversal pattern, yet there are strong possibilities that a bullish variant of the stalled pattern may also appear during a downtrend in the market.
- The stalled candlestick pattern is a 3-bar reversal pattern.
- The first candle has a long body.
- The second candle is shorter and in the same direction than the previous candle.
- The third candle is the smallest of all but it also continues in the same direction.
The bearish stalled candlestick pattern
The stalled pattern is a bearish reversal pattern that appears during an uptrend and predicts the upcoming reversal of the bullish trend in the market. A deliberation pattern is another name of the bearish stalled candlestick pattern.
How to identify the bearish stalled candlestick pattern?
The bearish stalled candlestick pattern has the following criteria that can help to identify the pattern.
- The first candle is a bullish candle that has a long body.
- The second candle is also a bullish one that continues to increase but is shorter than the previous candle.
- The third candle is the smallest of all but it also continues but cannot exceed the high of the prior candle.
- Each candle must open and close higher than the previous candle.
- The third candle must open near the close of the second candle and it must have a long upper wick.
What does the bearish pattern tell traders?
The appearance of the first big bullish candle indicates the presence and strength of the current bullish trend in the market. The next two candles are much shorter and the last one is the smallest. The decreasing size of the bullish candles indicates that the bulls are losing momentum and bears are getting control of the market. It also indicates that the losing positive momentum creates a resistance that the price is struggling to break. All those indications point to a pullback or a bearish trend reversal in the market.
The bullish stalled candlestick pattern
The bullish stalled pattern is a bullish reversal pattern that appears during a downtrend in the market. It predicts the upcoming bullish reversal of the trend. However, the bullish stalled pattern is a very rare pattern as compared to the bearish stalled pattern.
How to identify the bullish stalled candlestick pattern?
The bullish stalled candlestick need to meet the following conditions.
- The first candle must be a bearish candle with a long real body.
- The second candle is also a bearish one with a real body smaller in size than the prior candle. The second candle must also open close to the prior day’s close.
- The third candle is again a bearish candle that is smallest of all.
What does the bullish pattern tell traders?
The bullish stalled candlestick pattern predicts an upcoming reversal of the trend in the market. The appearance of the first candle indicates the strength and control of the bears. The subsequent two candles are smaller in size indicating that the bears are losing control. As a result of this loss of downward momentum, a support area appears that prices struggle to break. Hence, it is very much possible for the prices to perform a pullback or start a new bullish trend.