
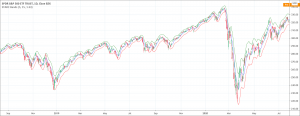
- The Stoller Average Range Channels (STARC) Bands helps traders know when to buy and sell.
- When market is in uptrend, the STARC bands suggest to buy near the lower band and selling near the upper band.
- When market is in downtrend, the STARC bands suggest the opposite.
The Stoller Average Range Channels (STARC) Bands is a technical analysis tool that predicts price movement. It measures the lower and upper bands around a simple moving average to predict the movements of prices. The STARC Bands attempts to cover most of the price action.
The Stoller Average Range Channels Bands is in fact a combination of two other simple indicators, the Simple Moving Average (SMA) and the Average True Range (ATR). The STARC Bands get plotted around the Simple Moving Average, so SMA is the core of the DTARC Bands. On the other hand, the Average True Range is its measure of volatility, and the Channel contracts and expands according to the changes in ATR.
The calculations of the Stoller Average Range Channels Bands
The calculations of the Stoller Average Range Channels Bands are very simple. There are only two elements.
Upper STARC Band = Simple Moving Average + Average True Range
Lower STARC Band = Simple Moving Average – Average True Range
However, before the calculations, a user-specific multiplier factor, which is mostly 2, is multiplied to the ATR. We also know that the SMA commonly tracks back 6 periods, therefore, the most comprehensive formula for the STARC Bands becomes:
Upper STARC Band = 6-Period Simple Moving Average + (Average True Range × 2)
Upper STARC Band = 6-Period Simple Moving Average – (Average True Range × 2)
How to interpret the Stoller Average Range Channels Bands?
As we have already discussed that the STARC Bands encompasses most of the price action, thus it sets boundaries for the normal price movements. Therefore, any price fluctuations going out of the bands zone are generally considered as excessive or as an indication that the current market trend is strengthening. There are the following two ways to interpret the boundary break of the STARC Bands.
Range bound market
Traders expect stall and retrace back to the SMA break outside of the STARC Bands when the market is range-bound. For example, if the declining price breaks out of the lower band and the market is trading sideways, it is an indication of a market reversal back towards the SMA.
Trending market
Traders do not expect the price retracement back to its initial level or to touch the lower boundary of the STARC Bands after breaking out of the upper band when the market is trending. It is an indication of the accelerating current market trend. In such cases, there are strong chances of market consolidation at higher levels it just reached.
How to trade with the STARC Bands?
The rules for using the Stoller Average Range Channels Bands in trading are very simple. During an uptrend, traders may go for buying when the price is near the lower STARC Band. They can close the deal when the price reaches near the upper STARC Band. During a downtrend, traders may go for a sell position when the price is near to the upper STARC Band. The can close their trade when the price reaches the lower band.