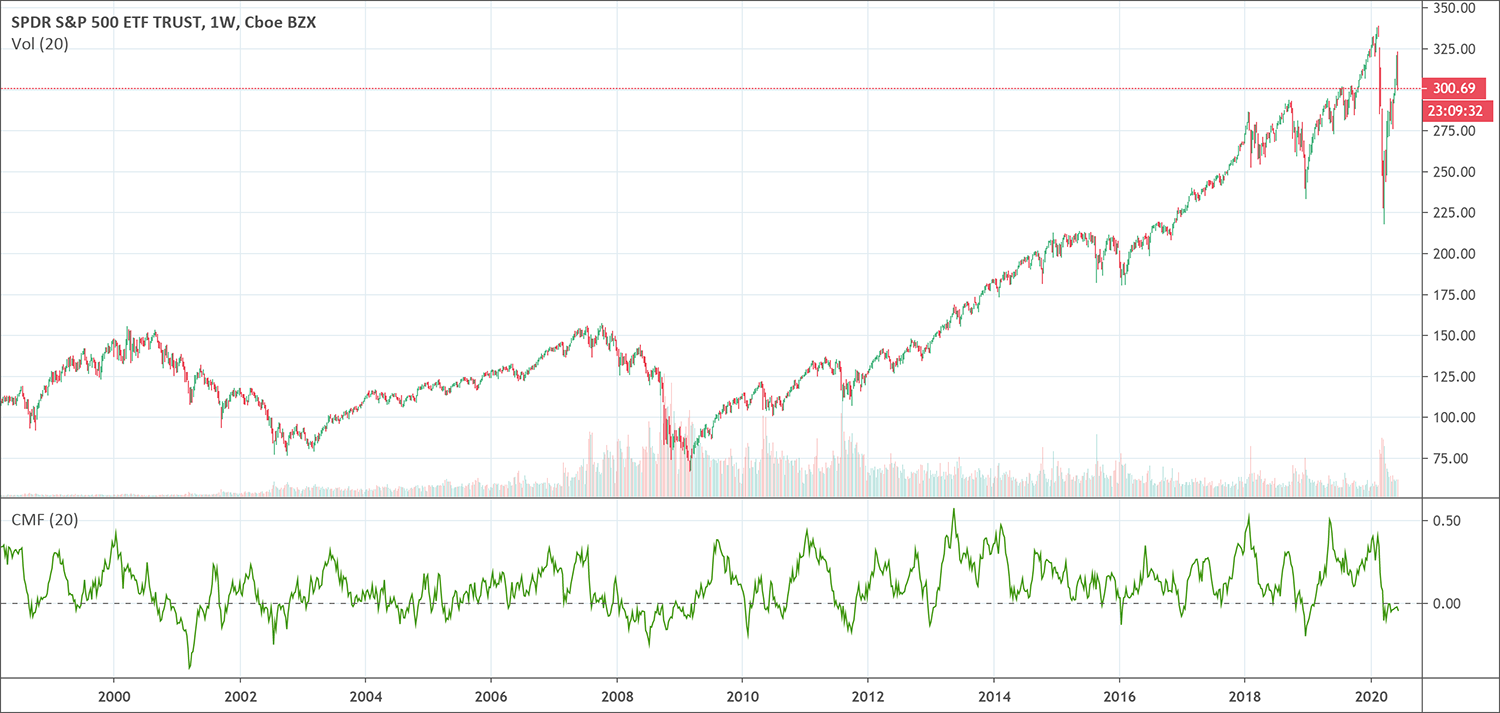
Chaikin Money Flow Indicator (CMF)
Created by Marc Chaikin, this Chaikin Money Flow indicator measures the amount of money flow volume over a particular time. Money flow volume is the basis for the accumulation/distribution Line. … Read more

Momentum is the key feature for movement. The same is true for trading.
It’s easier to push a moving wagon than to make it start. The same is true for trading.
Momentum traders need tools to understand if an asset is likely to start to move, continue it’s move or reverse and go the opposite direction.
Momentum indicators are technical analysis tools to help traders understand if price has the energy to move (hence momentum). They often are computed using price movement, closing price and current price.
The most popular momentum indicators are RSI, Stochastic Oscillator, MACD Indicator and many more are available (more than 20 different indicators).
Each of these technical indicators are very easy to add to your price chart using TradingView. As you likely noticed, most of the price charts visible on our site are taken from this tool.
Click here if you want to test TradingView for free!
Momentum indicators can be used in 2 principal ways:
Keep in mind that although very powerful, as everything else in technical analysis, it remains based on probabilities and can create false signals.
Momentum indicators allow traders to better understand the speed at which the price of a given security changes. They are a great hint to understand the strength of price movements.
What are the current market trends?
Is it a strong trend or will the current trend likely to reverse?
You need good tools to figure out!
Here, you’ll find more than 20 momentum indicators described here. Each of them can greatly integrate with chart patterns so you can increase your chance of a trade going your way.
Want to go into the details of a specific volume indicator? You’re at the right place!
Feel free to discover the detailed article for each and every volume indicator right below :
Created by Marc Chaikin, this Chaikin Money Flow indicator measures the amount of money flow volume over a particular time. Money flow volume is the basis for the accumulation/distribution Line. … Read more
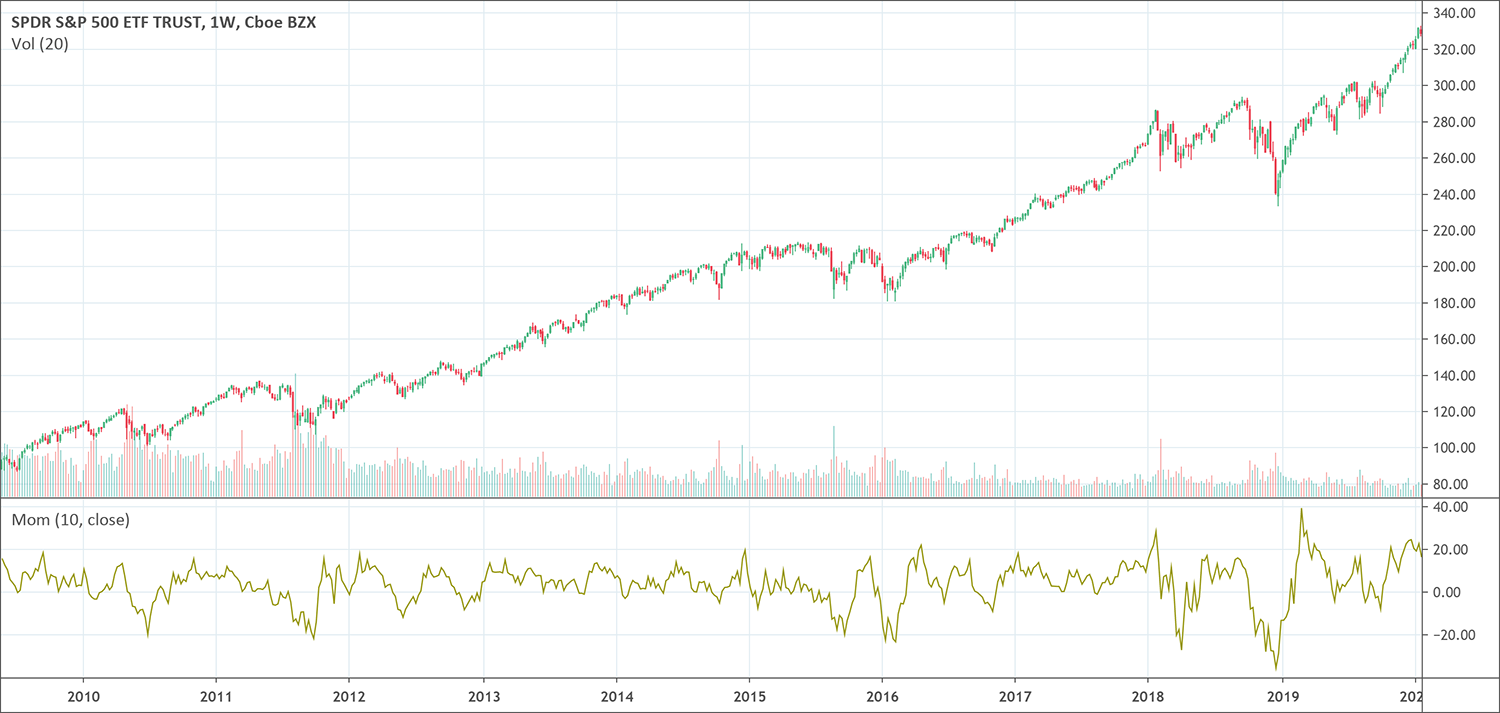
Traders use momentum indicators to have a better understanding of the speed or rate at which the price of a security changes. Momentum indicators are best used with other indicators … Read more
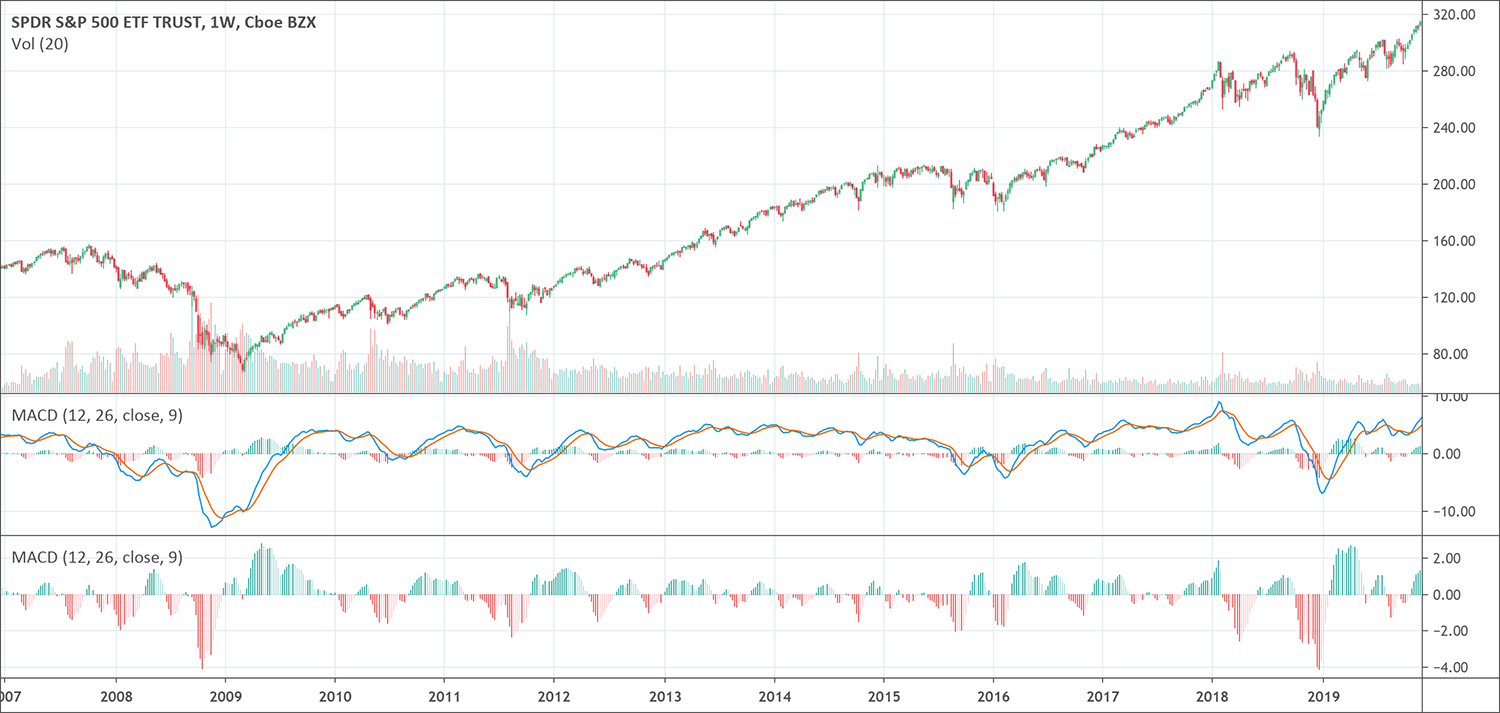
The Moving Average Convergence Divergence (MACD) is both a momentum and trend following indicator. It is calculated by subtracting the 26-period EMA (Exponential Moving Average) from the 12-period EMA. There … Read more
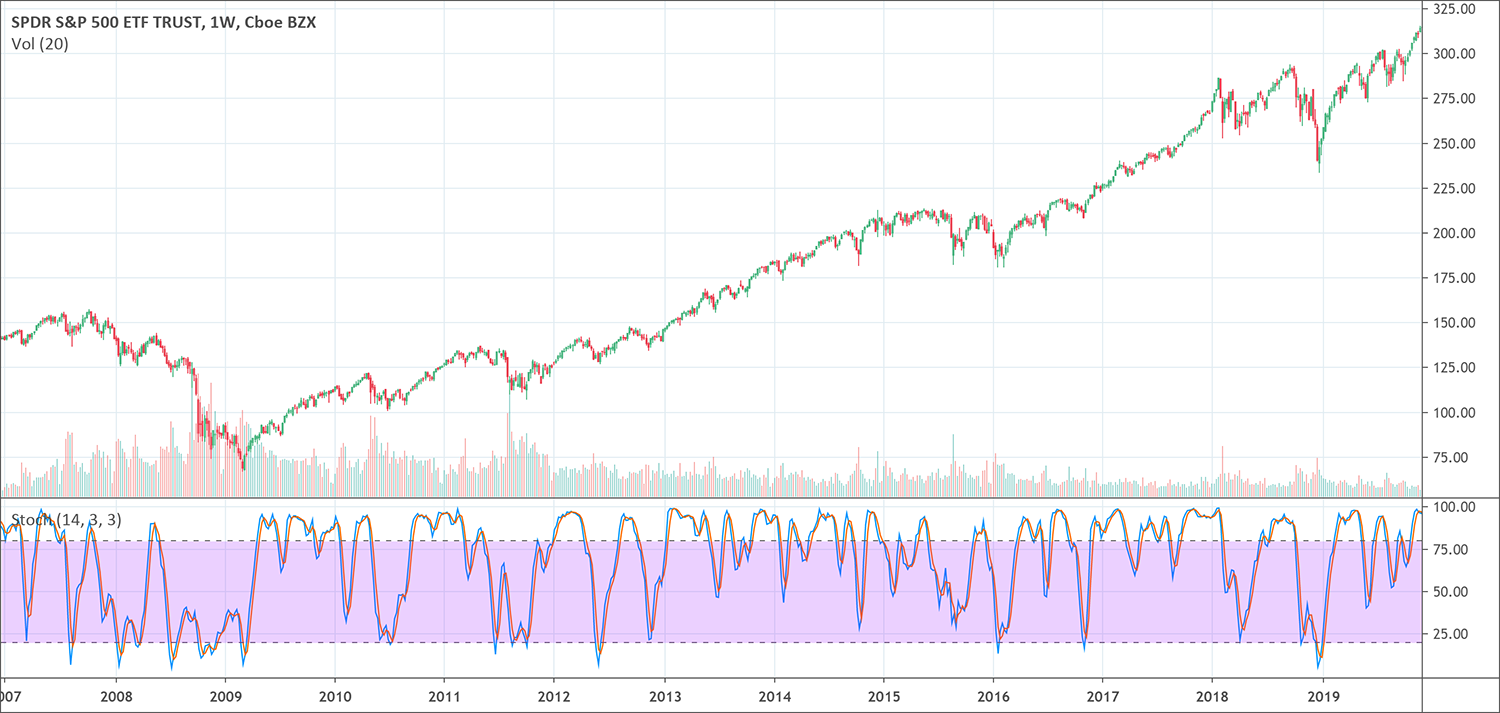
The stochastic oscillator is a popular momentum technical indicator. It gives traders overbought and oversold signals. What is the Stochastic indicator? The Stochastic Oscillator is a momentum indicator A stochastic … Read more
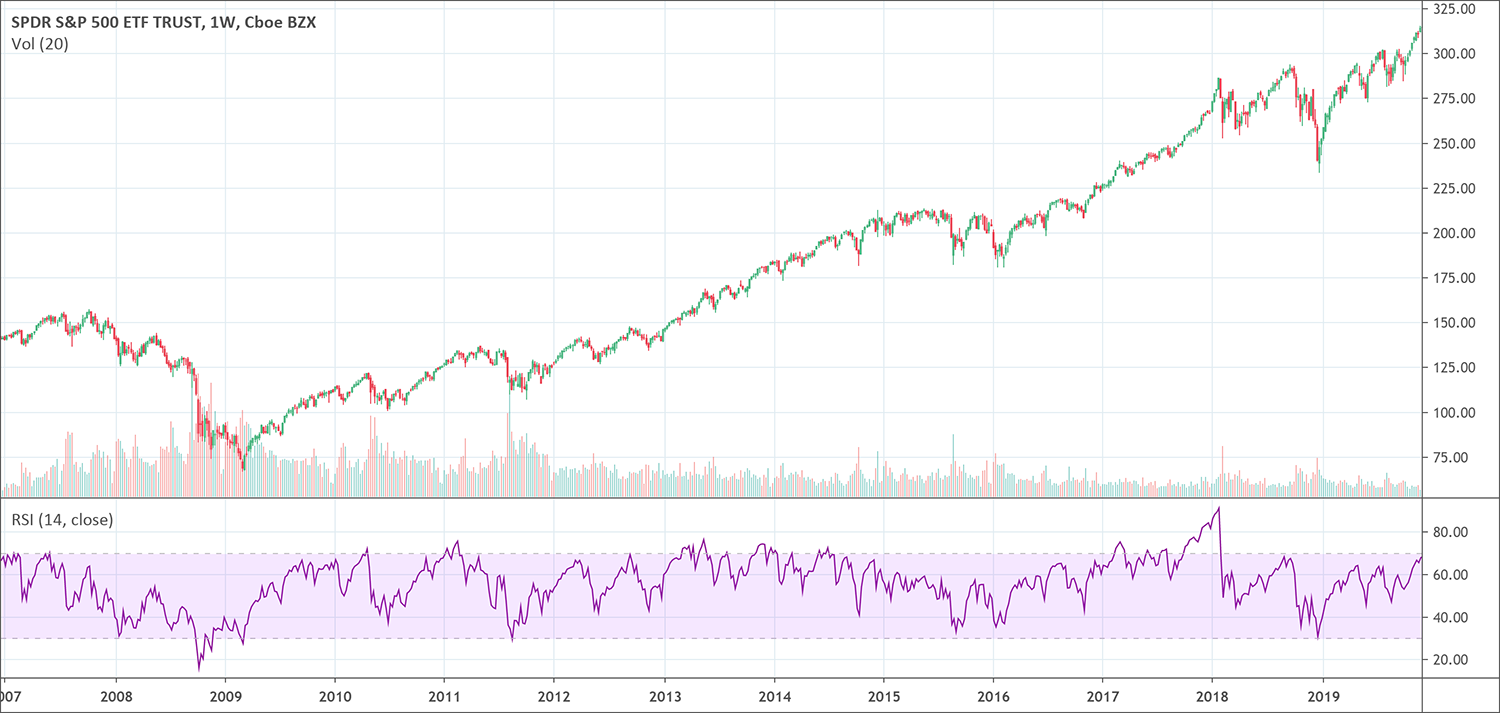
The RSI (Relative Strength Index) indicator is a popular momentum oscillator. It provides traders with bullish and bearish price momentum signal. When the RSI is above 70%, it’s considered overbought; … Read more
We research technical analysis patterns so you know exactly what works well for your favorite markets.
© PatternsWizard | Crafted with care by traders for traders
Trading is not appropriate for all investors, and the risks can be substantial. You agree and acknowledge further that the trading signals and contents provided to you by PatternsWizard are not, and are not intended to be, an offer or solicitation to enter into any transaction, or any type of trading or investment advice, recommendation or strategy. You acknowledge that it is solely your decision to determine which, if any, PatternsWizard trading signals and contents to use for trading (whether actual or simulated). Statistics provided are the result of backtests and are provided as is with no guarantee. Past performance is no guarantee of future results. Trading PatternsWizard signals may result in losses. Leverage can work against you as well as for you, and can lead to large losses as well as gains. You should only trade with funds that you can afford to lose. Based on the foregoing, you agree that you shall not seek to hold PatternsWizard, its managers or its developpers responsible for any losses associated with any trading signals or contents provided to you by PatternsWizard. CFDs are complex instruments and come with a high risk of losing money rapidly due to leverage. Between 74-89 % of retail investor accounts lose money when trading CFDs. You should consider whether you understand how CFDs work and whether you can afford to take the high risk of losing your money. PatternsWizard is for education purposes only.
Some of the links in this site are affiliate links. It means these websites will pay us a small commission at no additional cost to you if you buy from them.
PatternsWizard is NOT FINANCIAL ADVICE, trade responsibly.