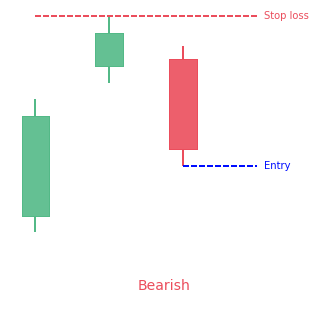
Upside Gap Three Methods Candlestick Pattern
The upside gap three methods candlestick pattern is a 3-bar bearish continuation pattern. It has 2 green candles and a red one. The second candle gaps above the first one. … Read more

Did you know there are more than 60 candlestick patterns?
They come in different shapes and sizes but they all share something in common : they are made of 1 to 5 candlesticks (I know you surely guessed it from its name).
Below you’ll find the ultimate database with every single candlestick pattern (and all the other types of pattern if you are interested). Here there are detailed articles for each candlestick pattern. Each article goes into detailed explanation, gives you examples and data. No more doubt about what makes a specific pattern and how well it works.
This extensive cheat sheet will definitely give you an edge and let you understand and recognize every pattern. Plus at PatternsWizard, our absolute focus is to bring you data-driven performance statistics. So for most patterns (articles below) you’ll find data about their performance and reliability (how often they confirm, reach the target or stop, how often they appear, …) to adjust your trading strategy.
Candlestick patterns are part of a way to represent market prices : the candlestick charts.
The best way to chart candlestick is using the TradingView solution. It lets you chart candlestick and all other charting types and you can try it now for free.
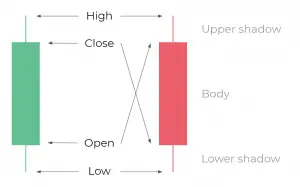
A candlestick is a way to represent an aggregation of all the prices traded for a given time period. It can for example aggregate a full trading day of prices. During this time period (which can take any value, from 1 minute to a few months), instead of showing every single price traded, a candlestick will only show 4 price values :
The area inside the open and close is the body. It’s often represented as filled and is either green or red depending on whether the market was bullish (went up) or bearish (went down). Outside of the body are the wick and tail (or sometimes called upper shadow and lower shadow). The upper shadow is from the body top to the highest price, the lower shadow is the opposite. They can create bullish candles or bearish candles. Candles help traders understand how the buying and selling pressure is applied during the given time interval.
Depending on the pattern (each pattern can tell a different story), they can be a hint for :
To learn more check out our candlestick chart article or signup to Joe Marwood’s course “Candlestick Analysis For Professional Traders” (he has more than 40k followers on Twitter so he knows what he talks about). He’ll tour you around with videos about the backtesting of 26 candlestick patterns.
Want to go into the details of a specific pattern. You’re at the right place!
These patterns often have colorful names. Feel free to discover the detailed article for each candlestick pattern right below :
The upside gap three methods candlestick pattern is a 3-bar bearish continuation pattern. It has 2 green candles and a red one. The second candle gaps above the first one. … Read more
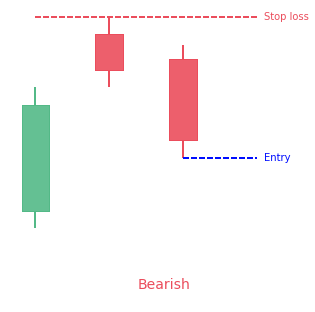
The Two Crows candlestick pattern is a three-line bearish reversal pattern. How to identify the pattern: The market must be in an uptrend. The first candle must be a long white candle. … Read more
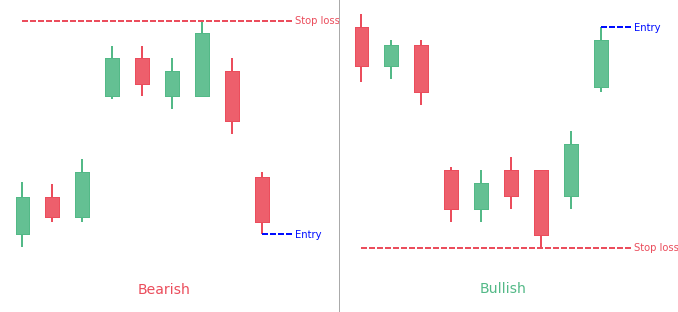
An Island Reversal Pattern appears when two different gaps create an isolated cluster of price. It usually gives traders a reversal biais. What is the Island Reversal candlestick pattern? The … Read more
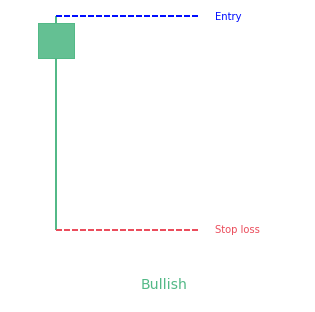
The Takuri candlestick pattern is a single candle bullish reversal pattern. It has a very small body with a much longer lower wick and without an upper wick. This pattern … Read more
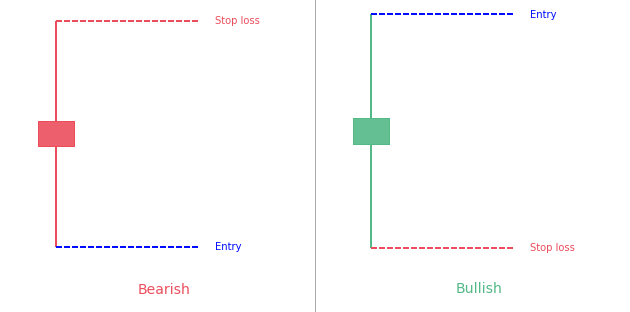
The Spinning Top candlestick pattern is a versatile single candle pattern. It is versatile and mysterious because of its formation that can occur at the peak of an uptrend, in … Read more
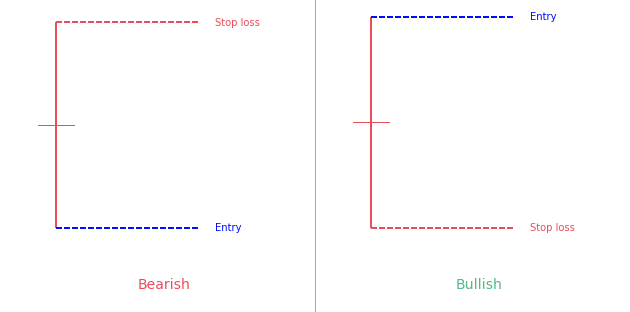
The Rickshaw Man candlestick pattern is very similar to the Long-Legged Doji pattern. A Long-Legged Doji pattern is the one that has a closing and opening price happening at or … Read more
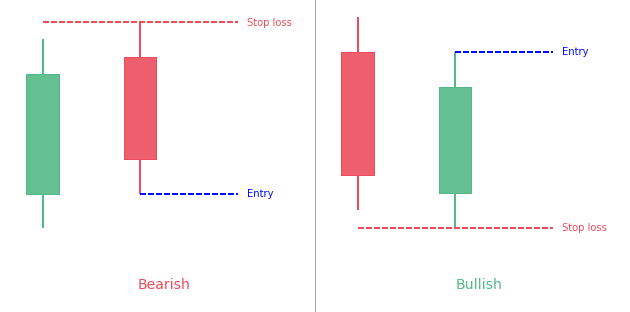
A Piercing line candlestick pattern is a two-day bullish candlestick reversal pattern that appears in a downtrend. It signals a potential short term reversal from downwards to upwards. It consists … Read more
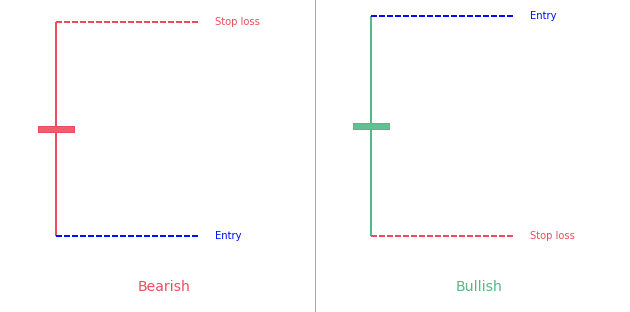
Candlestick patterns are becoming more and more popular these days for charting prices. They are easy to detect with their colorful bodies and black wicks and easy to observe the … Read more
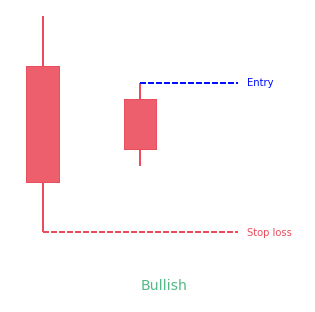
The Homing Pigeon candlestick pattern is a two-line candlestick pattern. Traditionally, traders consider it a bullish reversal candlestick pattern. However, testing has proved that it may also act as a … Read more
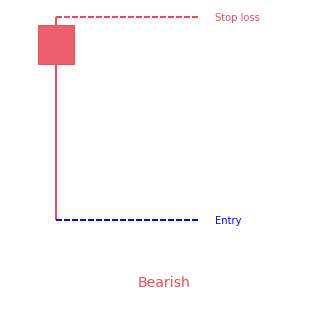
As the name suggests, the Hanging Man candlestick pattern is a bearish sign that appears in uptrends. On occasions, it also tells traders about the upcoming price reversal. The experts … Read more
We research technical analysis patterns so you know exactly what works well for your favorite markets.
© PatternsWizard | Crafted with care by traders for traders
Trading is not appropriate for all investors, and the risks can be substantial. You agree and acknowledge further that the trading signals and contents provided to you by PatternsWizard are not, and are not intended to be, an offer or solicitation to enter into any transaction, or any type of trading or investment advice, recommendation or strategy. You acknowledge that it is solely your decision to determine which, if any, PatternsWizard trading signals and contents to use for trading (whether actual or simulated). Statistics provided are the result of backtests and are provided as is with no guarantee. Past performance is no guarantee of future results. Trading PatternsWizard signals may result in losses. Leverage can work against you as well as for you, and can lead to large losses as well as gains. You should only trade with funds that you can afford to lose. Based on the foregoing, you agree that you shall not seek to hold PatternsWizard, its managers or its developpers responsible for any losses associated with any trading signals or contents provided to you by PatternsWizard. CFDs are complex instruments and come with a high risk of losing money rapidly due to leverage. Between 74-89 % of retail investor accounts lose money when trading CFDs. You should consider whether you understand how CFDs work and whether you can afford to take the high risk of losing your money. PatternsWizard is for education purposes only.
Some of the links in this site are affiliate links. It means these websites will pay us a small commission at no additional cost to you if you buy from them.
PatternsWizard is NOT FINANCIAL ADVICE, trade responsibly.