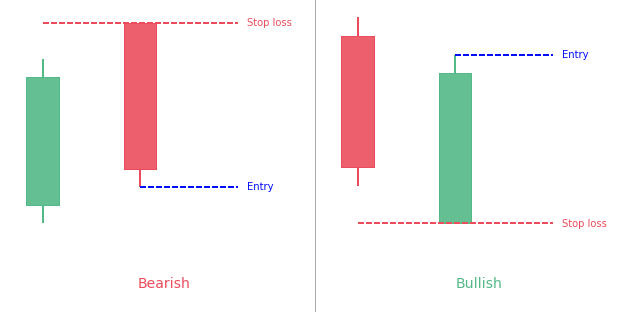
Belt Hold Candlestick Pattern: Trading Guide
All patterns have a unique tale to tell about market forces that lead to its formation. And traders might benefit by trying to identify what drove the market to where … Read more

Did you know there are about 100 different types of chart patterns?
They come in different shapes and sizes but they all share something in common : they are a key part of technical analysis and to be able to use them you first need to recognize them.
Below you’ll find the ultimate database with every single chart pattern. You’ll find detailed articles for each going into detailed explanation, giving you examples and data for each pattern. No more doubt about what makes a specific pattern and how well it works.
Moreover, this extensive cheat sheet will definitely give you an edge and let you understand and recognize every pattern. Plus at PatternsWizard, our absolute focus is to bring you data-driven performance statistics. So for most patterns (articles below) you’ll find data about each pattern’s performance statistics and reliability (how often they confirm, reach the target or stop, how often they appear, …) to adjust your trading strategy of financial markets.
Chart patterns are unique formations formed by changes in the price of securities on the price chart. They are the basis of technical analysis.
There are several types of patterns: classic patterns, candlestick patterns and harmonic patterns. As a result, each type has its own specificities. Identify patterns by lines that connect common price points (such as closing prices or high or low points) within a specific time period.
Technical analysts and chart experts seek to identify patterns to predict the future direction of security prices. These patterns can be as simple as a trend line or as complex as a double head and shoulders pattern.
There are three main categories that classify the chart patterns:
Each of these patterns have very strict requirements. To help you easily get your hands on each pattern we detailed them in their own article with everything you should know.
Of course, you can use these patterns in conjunction together, with other indicators or locations (resistance levels or resistance lines) to enhance your hints about future price movements before you take a trade.
Depending on the pattern (each pattern can tell a different story), they can be a hint for :
Regardless of the pattern(s) you’d like to hunt and trade, you’ll need a reliable source to chart your markets. TradingView is the best solution for you! As you may have noticed, most of our charts on the site are taken from charts created on TradingView. Click here to check TradingView for free now!
Want to go into the details of a specific pattern? You’re at the right place!
These patterns often have very imaginative names. Feel free to discover the detailed article for each chart pattern right below :
All patterns have a unique tale to tell about market forces that lead to its formation. And traders might benefit by trying to identify what drove the market to where … Read more
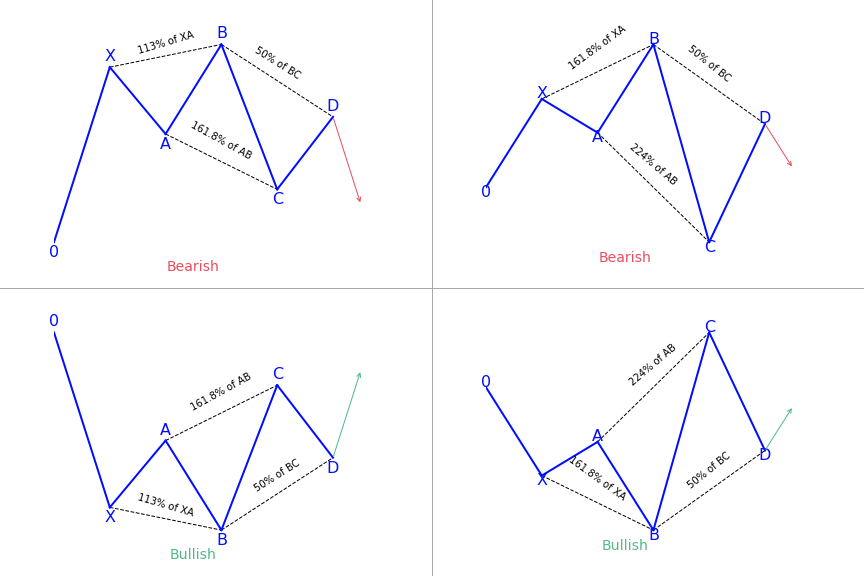
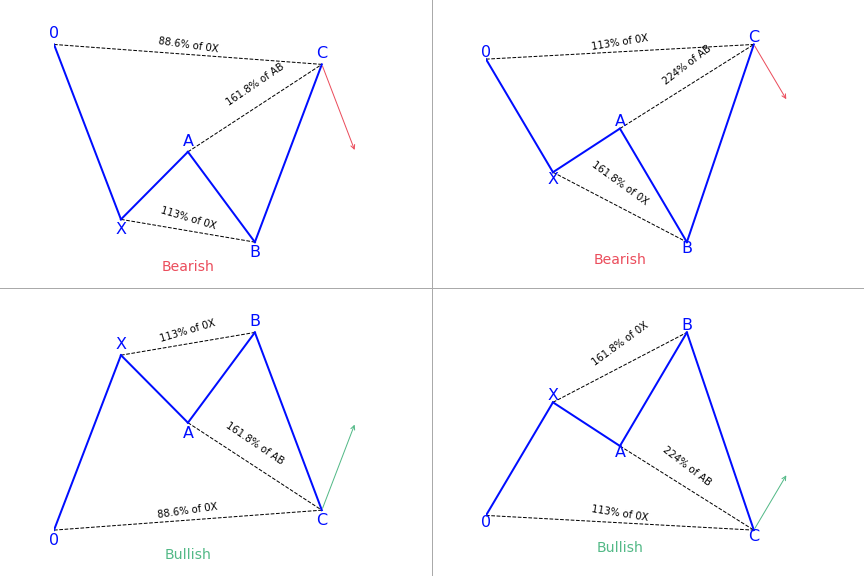
The 5-0 pattern is a reversal harmonic pattern. It follows specific fibonacci ratios (which you can read more below) Interested in learning more about harmonics pattern in general and you … Read more
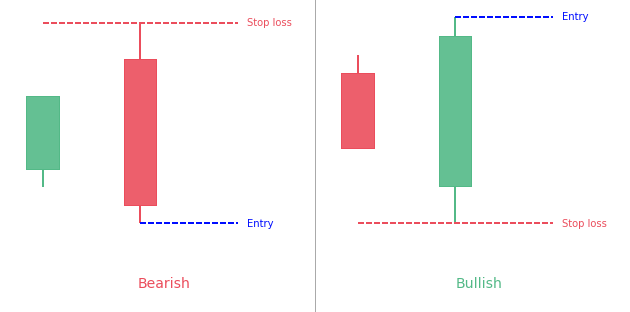
Most times, traders take a ‘ready, fire, aim’ process to trade which is a backward way of trading. Trade is different from a trade trigger. A trade setup that most … Read more
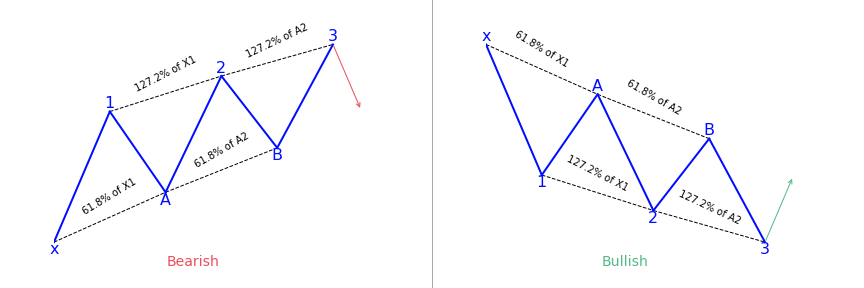
Trading with technical analysis demands traders to depend mostly on a mixture of technical indicators and trade based on the signals from this approach. Apart from using technical indicators, traders … Read more
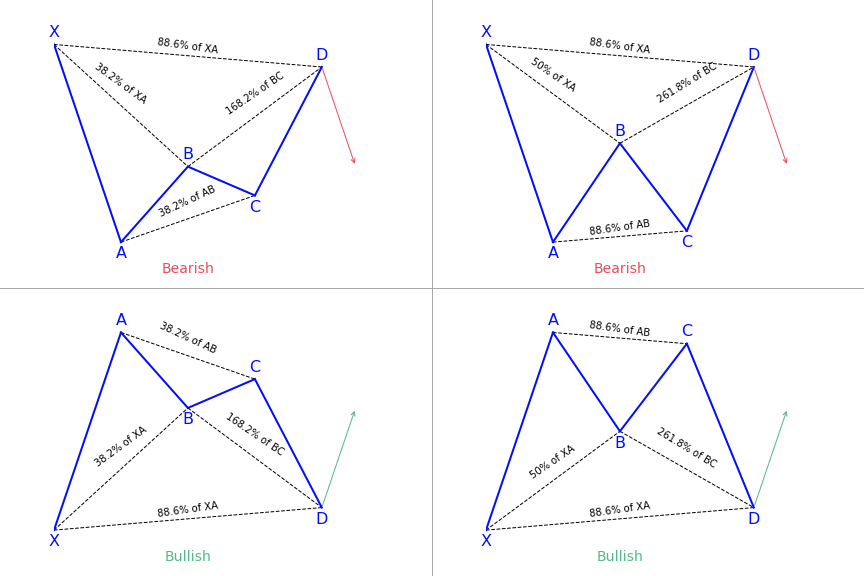
The Bat harmonic pattern is close to the Gartley pattern. It is a retracement and continuation pattern that comes up when a trend temporarily changes its direction but then continues … Read more
When it comes to harmonics, trading forex is very similar to the animal world. After crabs and butterflies, sharks have come to share their name with popular five-point patterns used … Read more
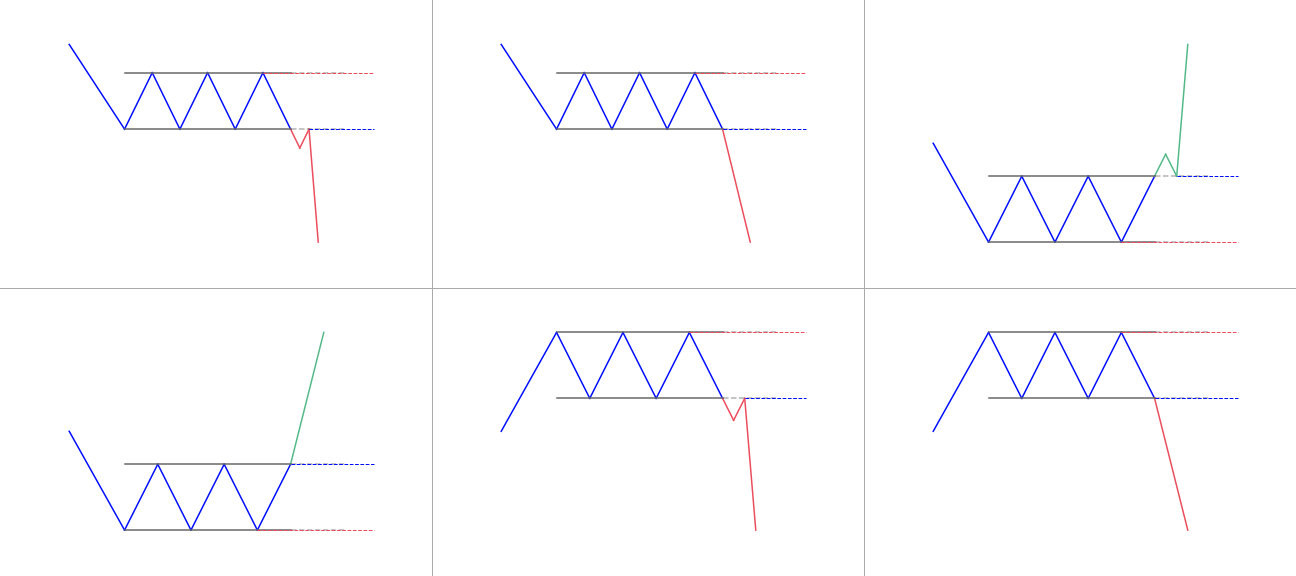
The Rectangle pattern is bullish or bearish depending on the direction of the breakout It forms when price oscillates between a horizontal support and resistance. What is the Rectangle pattern? … Read more
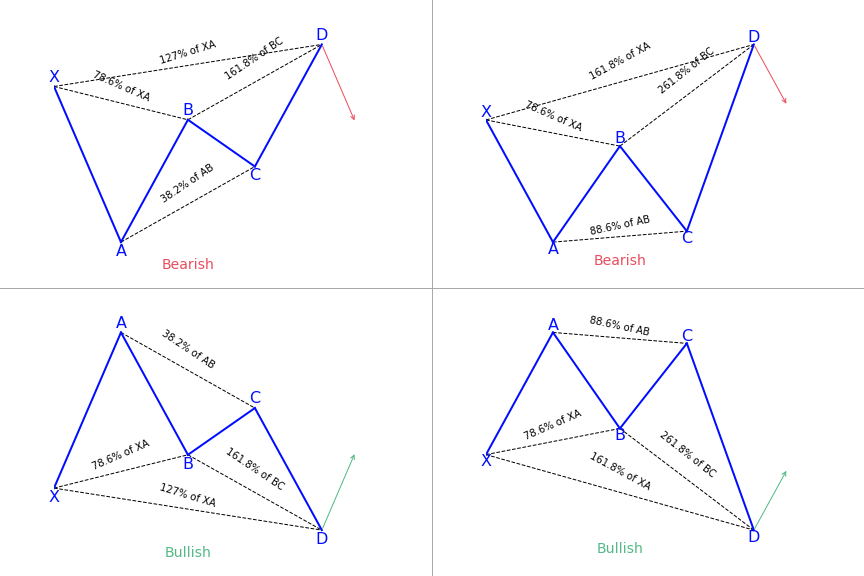
When you decide to trade, the secret to becoming successful is in reading patterns. Harmonic price patterns take geometric price patterns to the next level by applying Fibonacci numbers to … Read more
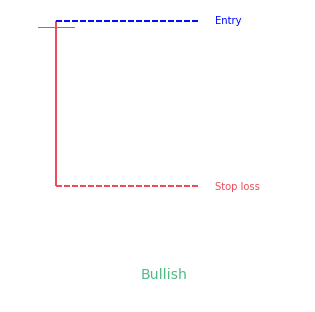
The dragonfly doji candlestick pattern is a 1-candle bullish pattern. It looks like the letter “T”. It prints when the candle as a long bottom shadow but (almost) no upper … Read more
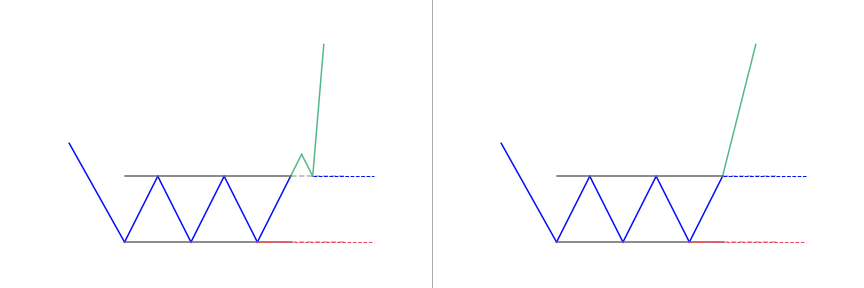
The triple bottom pattern is a bullish reversal pattern. It’s created when price bounces off support 3 time at similar levels. It’s a sign the buyers are coming in the … Read more
We research technical analysis patterns so you know exactly what works well for your favorite markets.
© PatternsWizard | Crafted with care by traders for traders
Trading is not appropriate for all investors, and the risks can be substantial. You agree and acknowledge further that the trading signals and contents provided to you by PatternsWizard are not, and are not intended to be, an offer or solicitation to enter into any transaction, or any type of trading or investment advice, recommendation or strategy. You acknowledge that it is solely your decision to determine which, if any, PatternsWizard trading signals and contents to use for trading (whether actual or simulated). Statistics provided are the result of backtests and are provided as is with no guarantee. Past performance is no guarantee of future results. Trading PatternsWizard signals may result in losses. Leverage can work against you as well as for you, and can lead to large losses as well as gains. You should only trade with funds that you can afford to lose. Based on the foregoing, you agree that you shall not seek to hold PatternsWizard, its managers or its developpers responsible for any losses associated with any trading signals or contents provided to you by PatternsWizard. CFDs are complex instruments and come with a high risk of losing money rapidly due to leverage. Between 74-89 % of retail investor accounts lose money when trading CFDs. You should consider whether you understand how CFDs work and whether you can afford to take the high risk of losing your money. PatternsWizard is for education purposes only.
Some of the links in this site are affiliate links. It means these websites will pay us a small commission at no additional cost to you if you buy from them.
PatternsWizard is NOT FINANCIAL ADVICE, trade responsibly.