
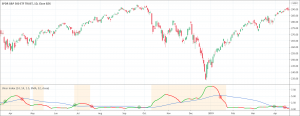
- The Ulcer Index indicator is a technical analysis tool that measures the downside risk considering both main factors, the depth and the duration of price fall.
- It is a 3-step calculation.
The Ulcer Index (UI) indicator bases on the idea of Ulcer disease. An ulcer is one of the most common and painful diseases. Ulcer means the reduction of a thick layer of mucus that protects the stomach of human beings. So why the name of the disease was given to a technical analysis indicator? To measure the drawdown the participants of the market expect to stomach on any security. Peter Martin and Byron McCann developed the UI indicator and introduced it in their book, “The investors guide to fidelity funds” released in 1989. Mutual fund traders were the main targets of the books.
What is the Ulcer Index indicator?
The UI indicator is a technical analysis tool that measures the downside risk considering both main factors, the depth and the duration of price fall. That means it is a risk-measuring indicator that measures the downside volatility. The downside volatility bases on the drawdowns. So to say, if traders want to measure the stress of holding security, they should try the UI indicator to find out the pain of continuously falling prices of the security.
How to calculate the Ulcer Index?
The UI calculation is simple and revolves around finding out the level of risks by analyzing how much a security’s price has fallen from the recent highs. The Ulcer Index calculation is just a three-step process.
Step one of the calculation
Drawdown % = ( Closing Price – Highest Closing Price over 14-periods ) ÷ The Highest Close over 14-periods
Step two of the calculation
Squared average = (The Sum of Percentage Drawdown Squared over 14-periods) ÷ 14
Step three of the calculation
The Ulcer Index = Square Root of the Squared Average
How to use the Ulcer Index?
The UI indicator is an excellent volatility indicator and gives traders the values of retracements of stock from recent highs. It can also help to assess the broad stock market and other markets. Apart from that, there are two main usages of the UI indicator. The first man’s use of the UI indicator is to use for technical analysis. For this purpose, first, calculate the moving-average time series of the UI and then use it to find out the amount of risk associated with the downside. The second main use of the UI indicator is to calculate risk-adjusted-performance. For this purpose, we can calculate the Martin ratio or the Ulcer Performance Index that has the following formula.
Martin ratio or the Ulcer Performance Index = (Mean Return – Risk-Free Return) ÷ Ulcer Index
Why traders should use the Ulcer Index indicator for trading?
The UI indicator is not much popular indicator among technical analysts and traders. Despite that, there are certain reasons that technical analysts and traders may consider using the UI indicator.
- The UI indicator is pretty much simple to use.
- The signals of the UI indicator are also very easy to pick and understand.
- The UI indicator has the potential to tell multiple things to traders as we have discussed in the above section.
- The UI indicator can also indicate some rare signals.