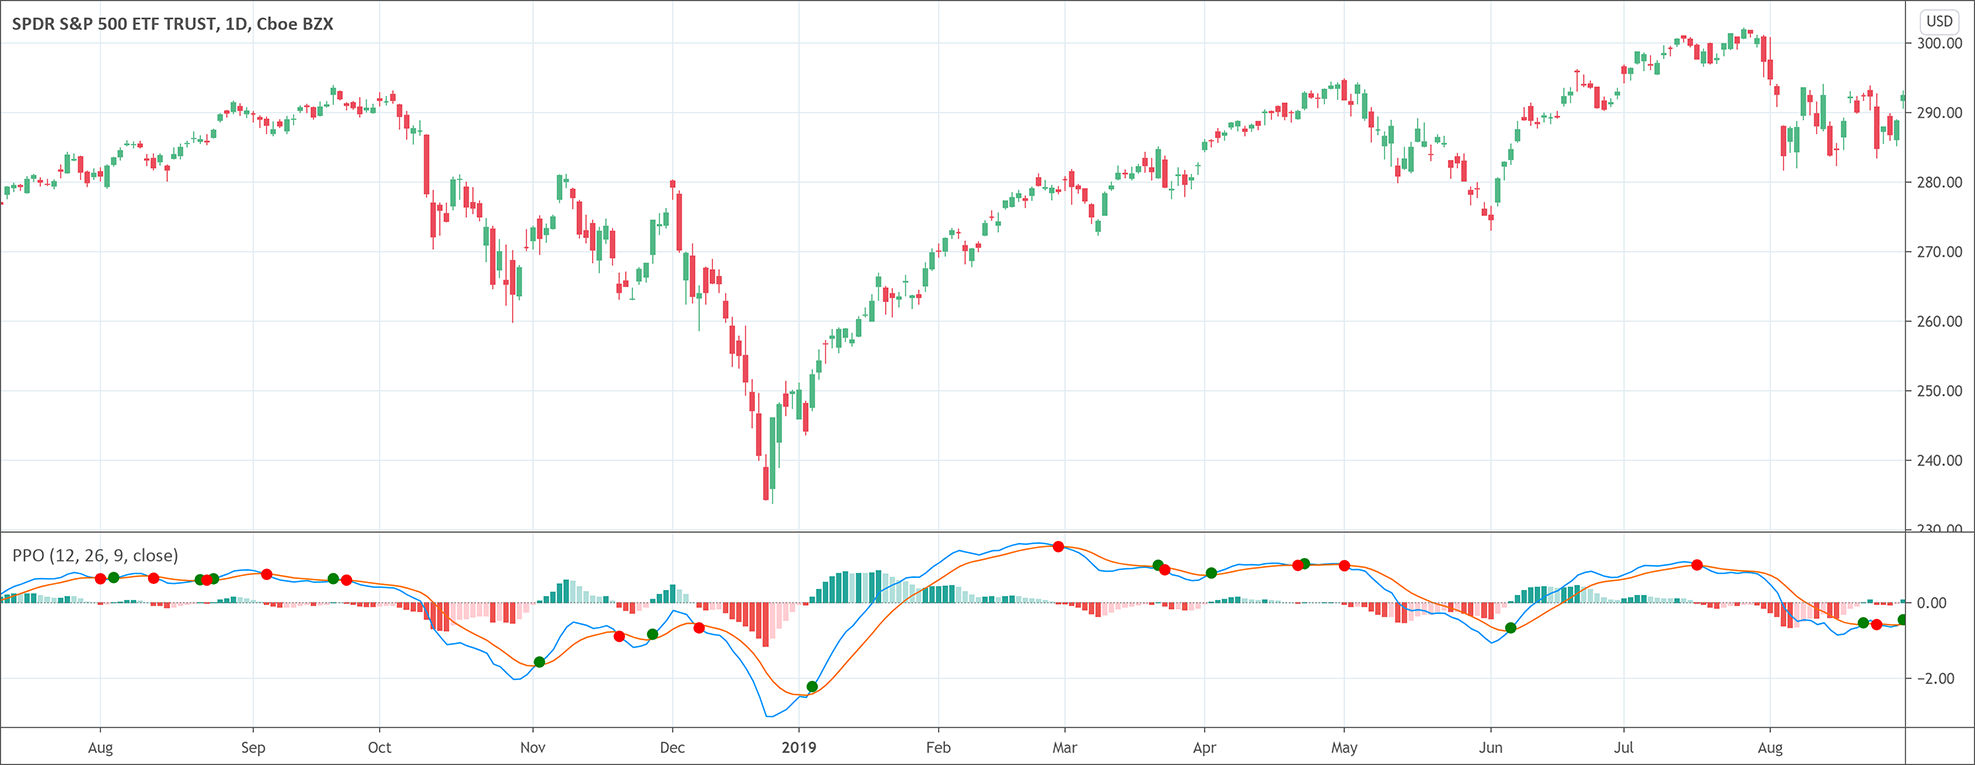
Percentage Price Oscillator indicator
The Percentage Price Oscillator is based off 2 moving averages. It is very similar to the MACD indicator. The Percentage Price Oscillator (PPO) is a technical analysis tool that measures … Read more

Technical analysis is a systematic way of analyzing and studying financial markets to make informed trading decisions. Technical analysis has been in practice for centuries, however, it has become extremely popular in the 21st century. Nowadays, data science and tools have become more advanced. Today, it is the age of the internet and more people have access to data and advanced tools to make informed trading decisions.
Technical analysis includes researching stock price charts and various indicators derived from (basic) prices in order to predict the development of the market.
Technical analysis or TA is the study of the past movements of financial markets and securities including price and volume. It works on the simple principle that history repeats itself. That means the financial markets have a tendency to move in repeated and consistent patterns. So, through study and analysis of the past price and volume movements, those patterns are identified and their future movements are predicted. This information is extremely useful that enables investors to make informed decisions.
Technical analysis is one of the two major analytical techniques to analyze financial markets. The second one is fundamental analysis. Fundamental analysis focuses on figuring out the true value of stocks. On the other hand, technical analysis focuses on identifying patterns on a chart to predict future price movements.
This graphic extrapolation method is applicable to all types of markets: indices, stocks, interest rates, commodities…, so it is not limited to the stock market (stock market); once the supply and demand meeting determines the price, the same tools and methods are possible to apply to any type of underlying asset.
The main tool of the technical analyst is graphics, which can visualize and analyze the underlying assets.
The biggest helping tool in technical analysis charts. Technical analysts are so much engrossed in charts that they are branded as chartists. They rely on charts because charts are the easiest and most convenient source to visualize past price and volume data. Technical analysts analyze charts to find patterns and trends that eventually help them in spotting some profitable trading opportunities.
The best way to chart your technical analysis is using the TradingView solution. It lets you chart all the patterns and indicators you’d like on every chart type. You can try it now for free!
The technical analysis presents a totally different picture of a company and demands a focus on price data and movements. You need to observe market trends and patterns to predict the market’s future movements. You may use the following technical indicators to conduct technical analysis.
There are two main types of technical analysis.
The accepted purpose and reason for existence of technical analysis is to predict trends and signs of trend reversal. This is a question of determining market conditions (significant numbers and/or signals given by mathematical tools) that statistically produce the same results.
Technical analysis does not pretend to be an accurate science. It is closer to human science, because its research object is directly focused on the understanding of market psychology.
There are the following three basic principles of technical analysis.
Technical analysis was first used by the Japanese around the 17th century for the rice market. They introduced a specific way to draw the price: the Japanese candlesticks. It helped them aggregate the price for a given period.
Technical analysis focuses on the following basic factors.
Technical charting theories build on a few main assumptions. It partly explains why it is also a very controversial topic.
Technical analysis works on the same basis across all the tradable instruments. It works with the purpose of forecasting future price movements including stocks, futures, bonds, and forex instruments. There are various patterns and signals that help analysts during technical analysis. Moreover, analysts have also developed various trading systems that help in forecasting and trading on price movements. Technical analysis works on the basis of such tools and trading systems. Trendlines, channels, moving averages, and momentum indicators are among the most widely used indicators and charting patterns.
Identification of the signals for price trends in a market is the basic and very important component of any trading strategy. Technical analysis is the best option in this regard. It helps traders to find the best entry or exit points. However, it is also very important to note that market behavior is not 100% accurately predictable. Although technical analysis gives us an insight into the likely price movement of a stock or security, it doesn’t promise success. Moreover, technical analysis alone doesn’t guarantee success. Always remember that successful trading also relies on proper risk management, discipline, and your ability to keep your emotions under control.
You’ll find below all the articles for each single technical analysis patterns, indicators and concepts. We sincerely hope it’ll help you succeed!
The Percentage Price Oscillator is based off 2 moving averages. It is very similar to the MACD indicator. The Percentage Price Oscillator (PPO) is a technical analysis tool that measures … Read more
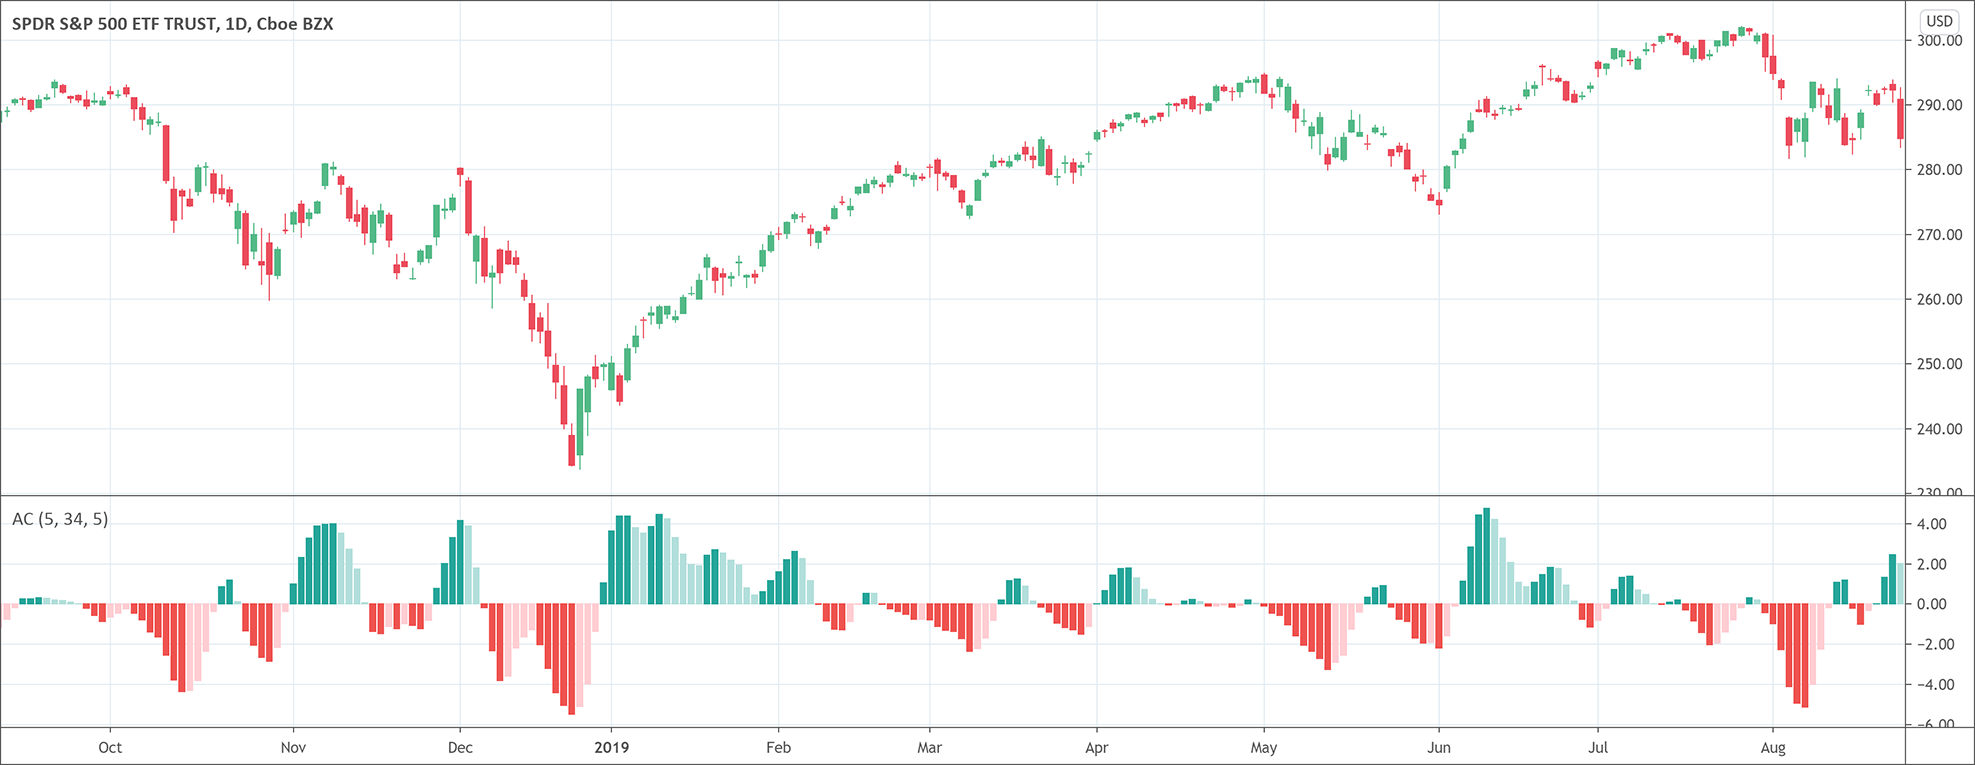
The Accelerator Oscillator helps gauge the momentum in the market. It helps predict when the momentum will change. The Accelerator Oscillator measures the acceleration or deceleration of the current driving … Read more
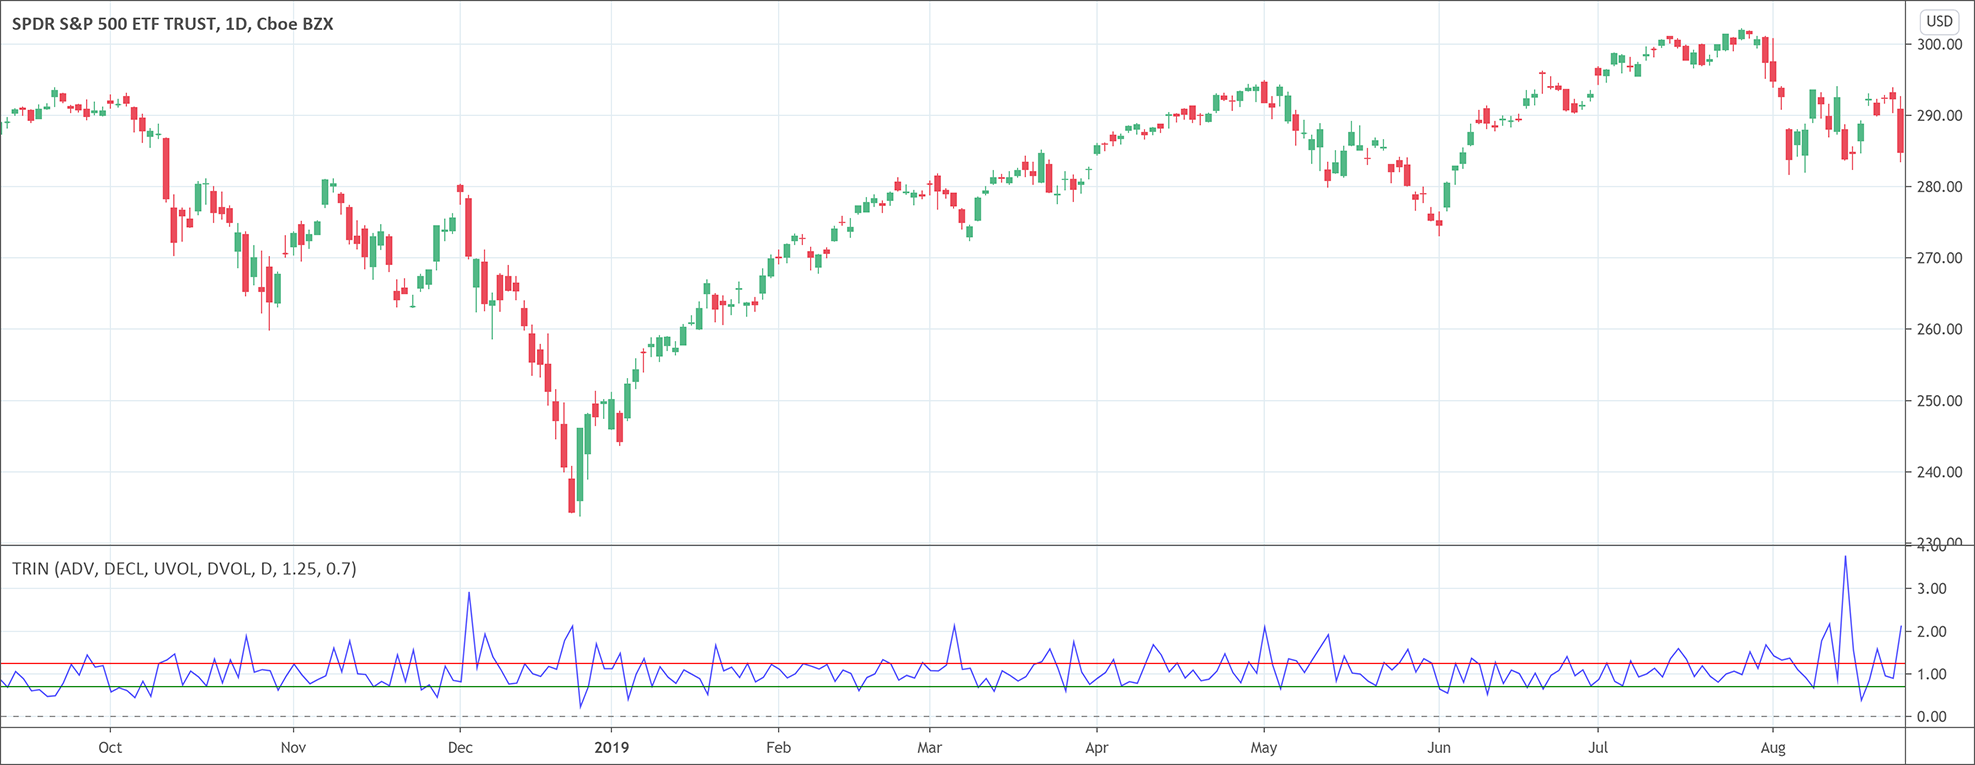
Arms Index and TRIN indicators are two names for the same indicator. The Arms Index is an oscillator which measures market volatility. It helps to gauge the overall sentiment in … Read more
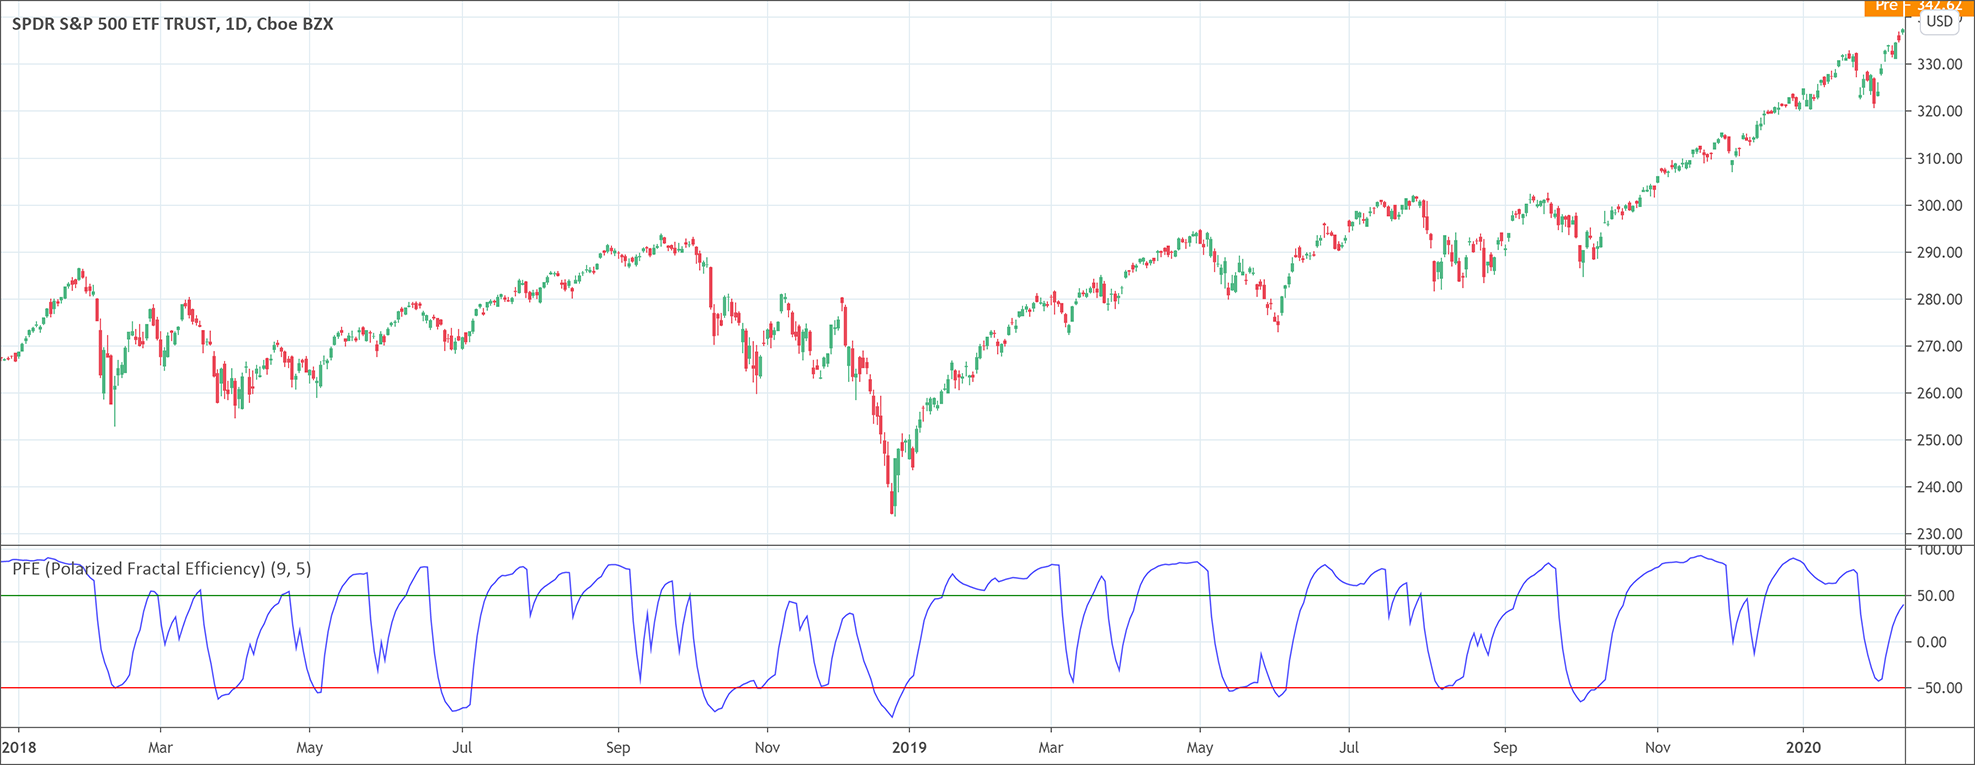
The Polarized Fractal Efficiency (PFE) indicator helps determine the price efficiency. It determines the strength and direction of the trend. What is the Polarized Fractal Efficiency indicator? The Polarized Fractal … Read more
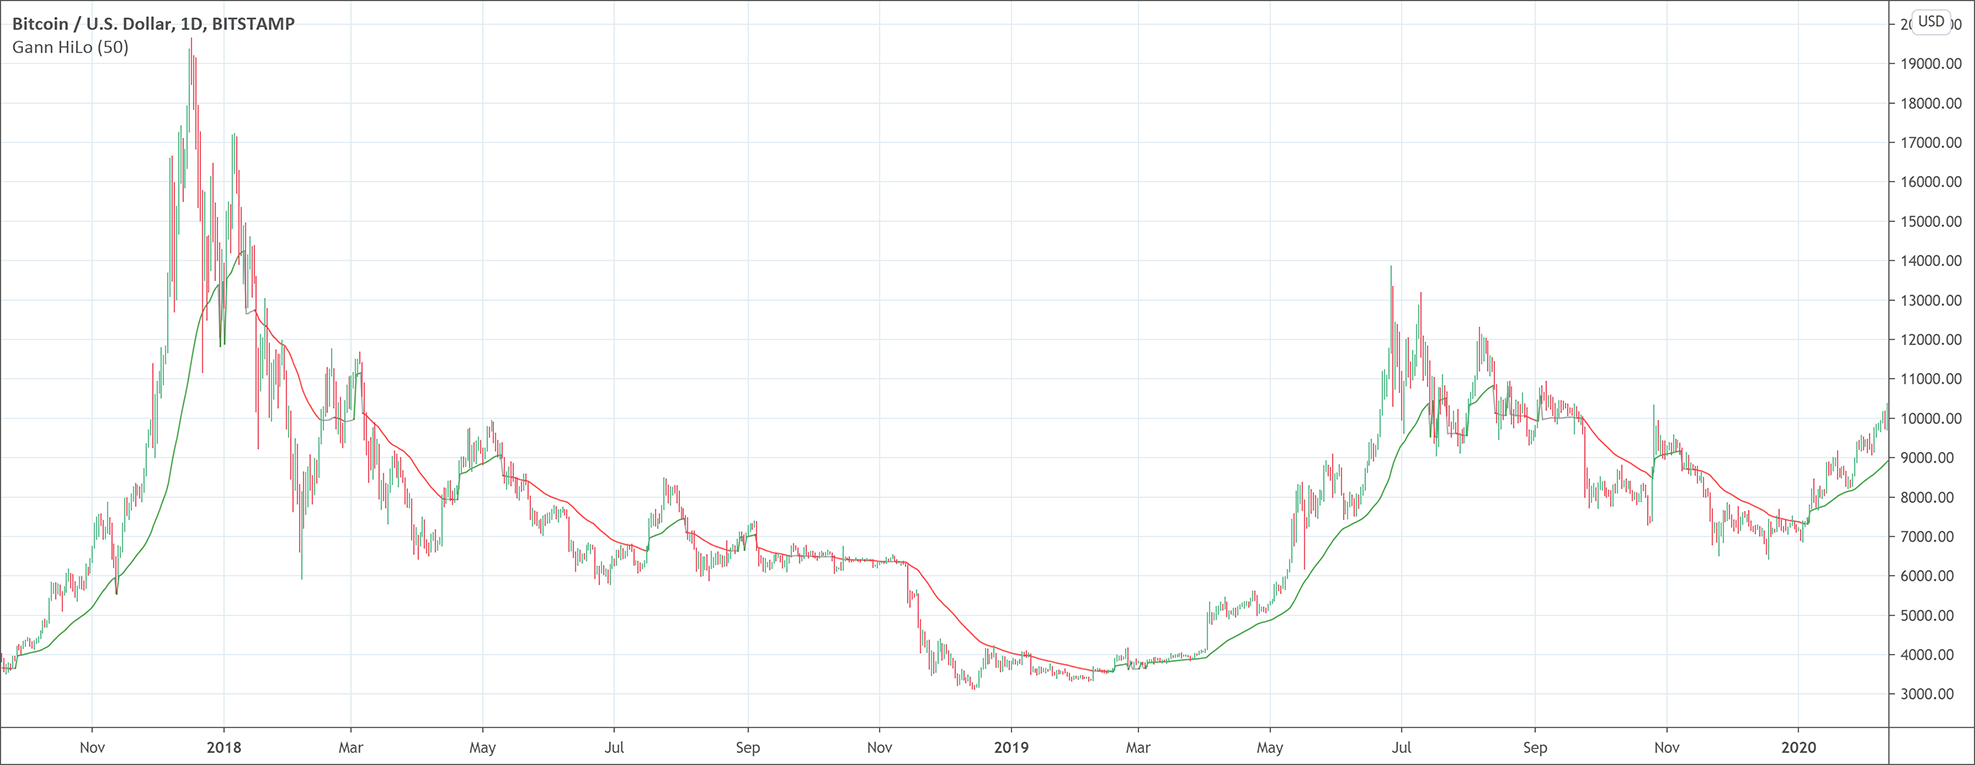
The Gann HiLo indicator helps traders determine the direction of the trends. It is built of a moving average. The Gann HiLo Activator is a technical analysis tool that follows … Read more
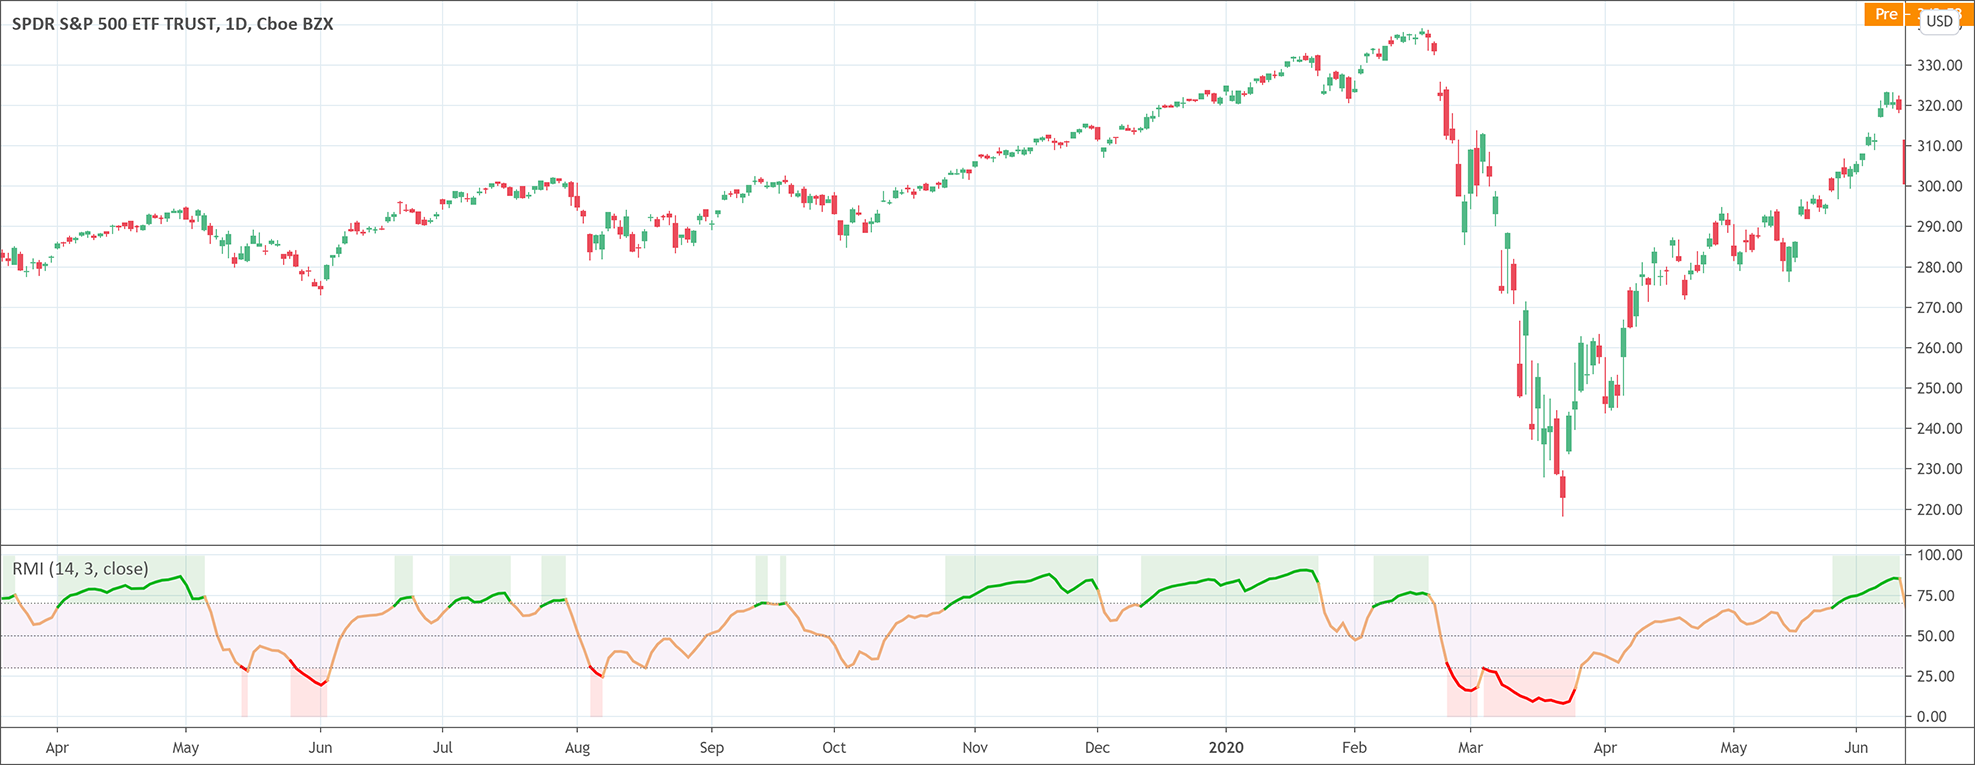
Relative Momentum Index (RMI) indicator tries to improve the reading of the RSI indicator. It calculates a ratio of upwards changes to downwards changes in prices over N-period bars. It … Read more
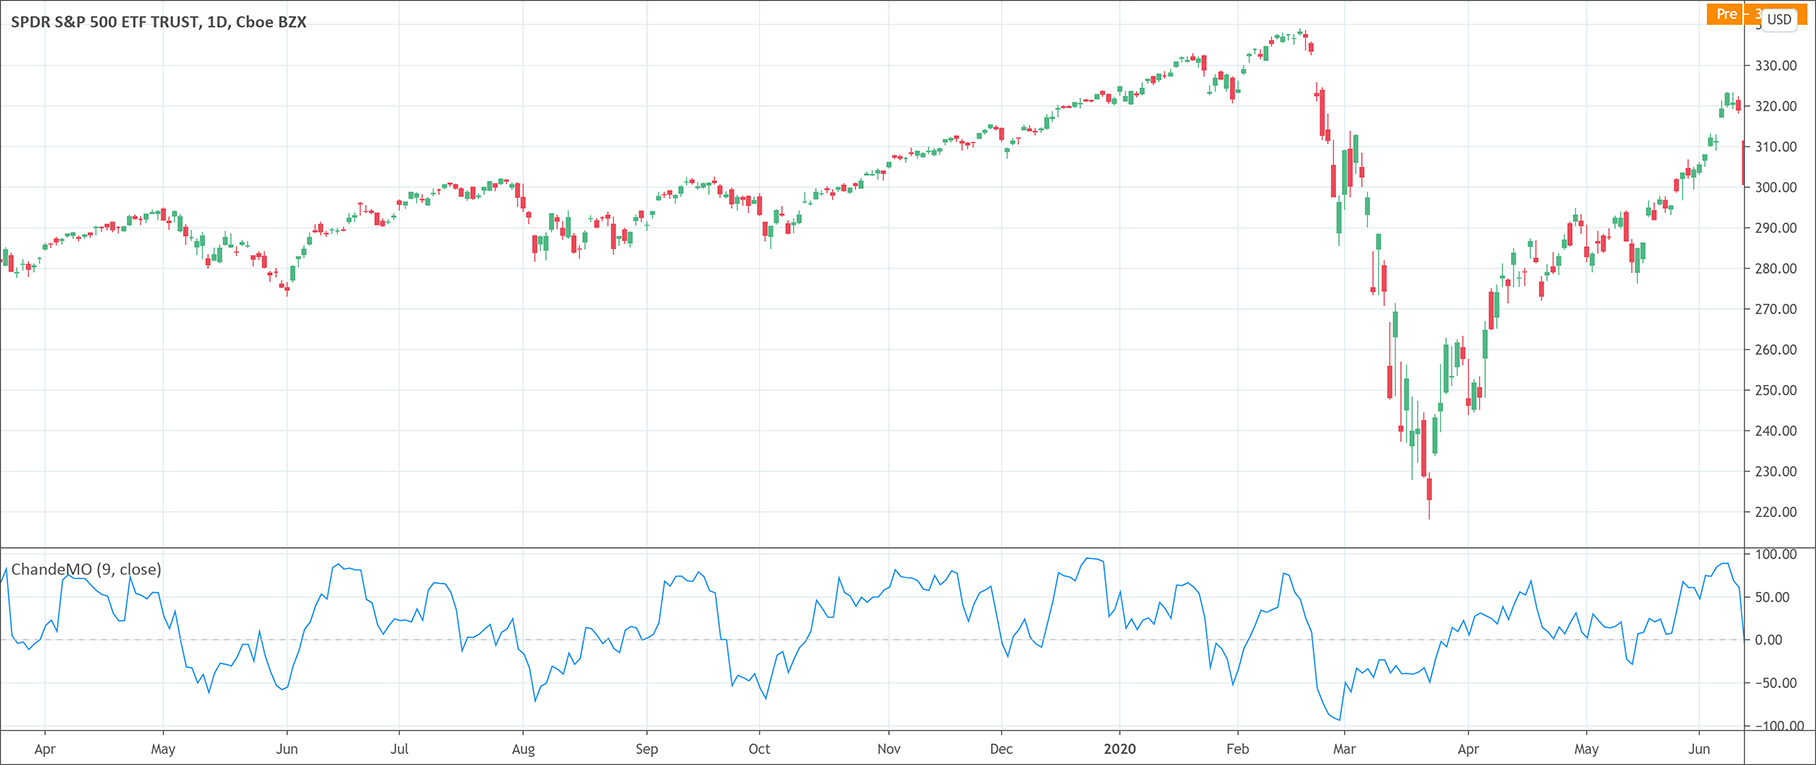
The Chande Momentum Oscillator (CMO) is a momentum indicator. It is calculated as the difference between the sum of all recent ups and the sum of all recent downs and … Read more
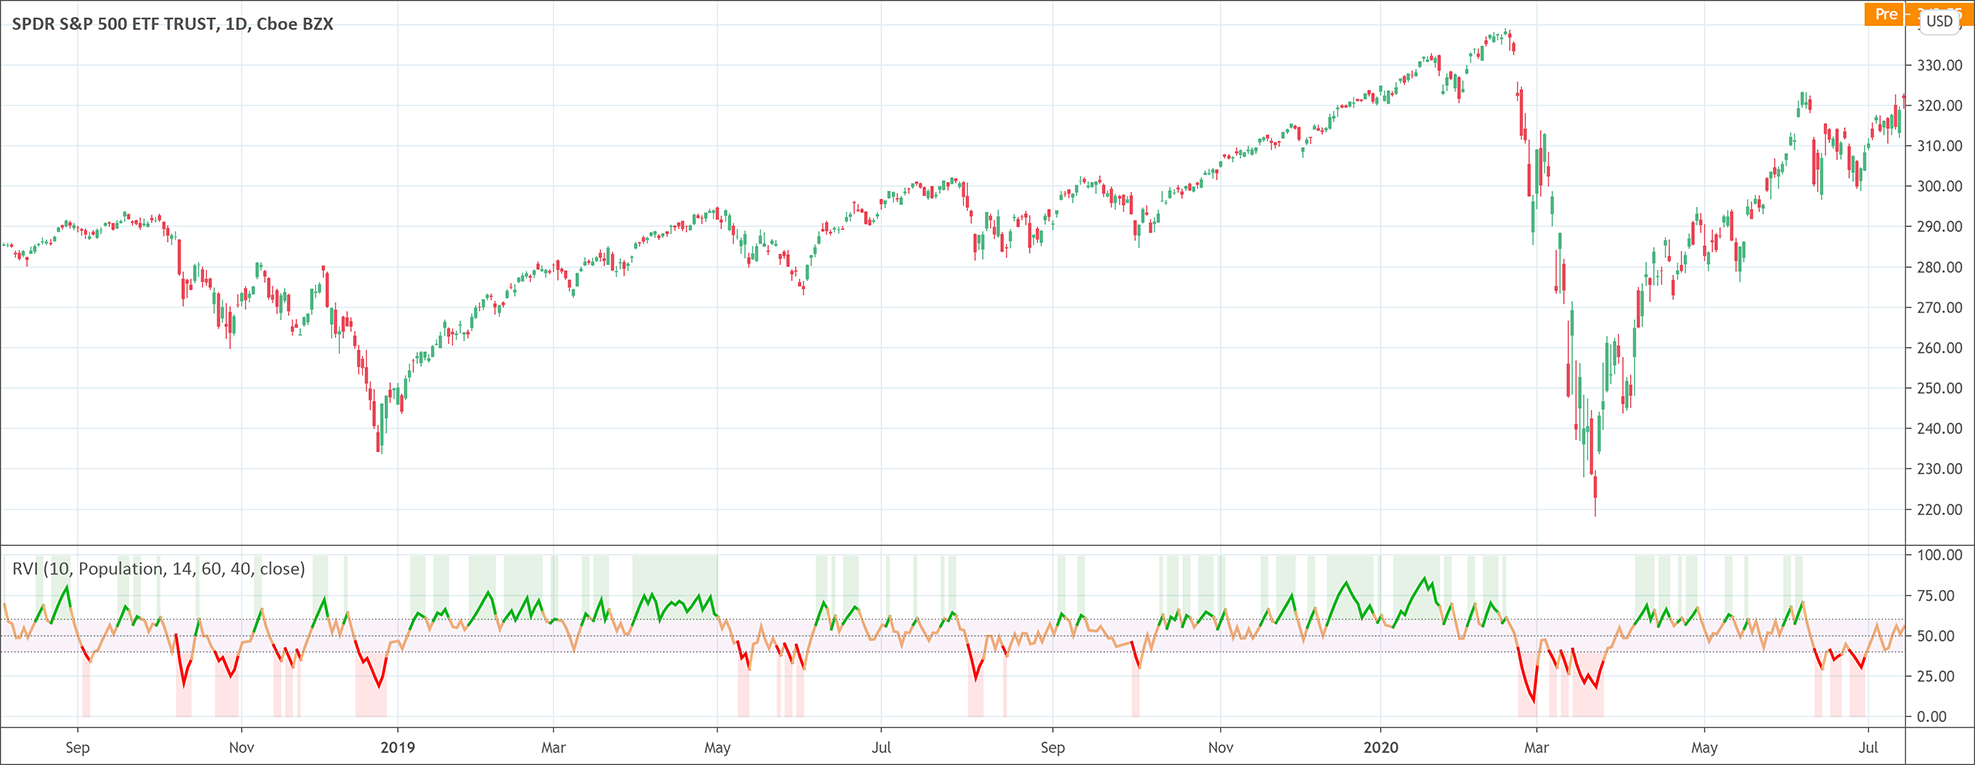
The Relative Volatility Index (RVI) is a volatility indicator. It is best to use it in conjunction with other momentum or trend following indicators to confirm trends. The Relative Volatility … Read more
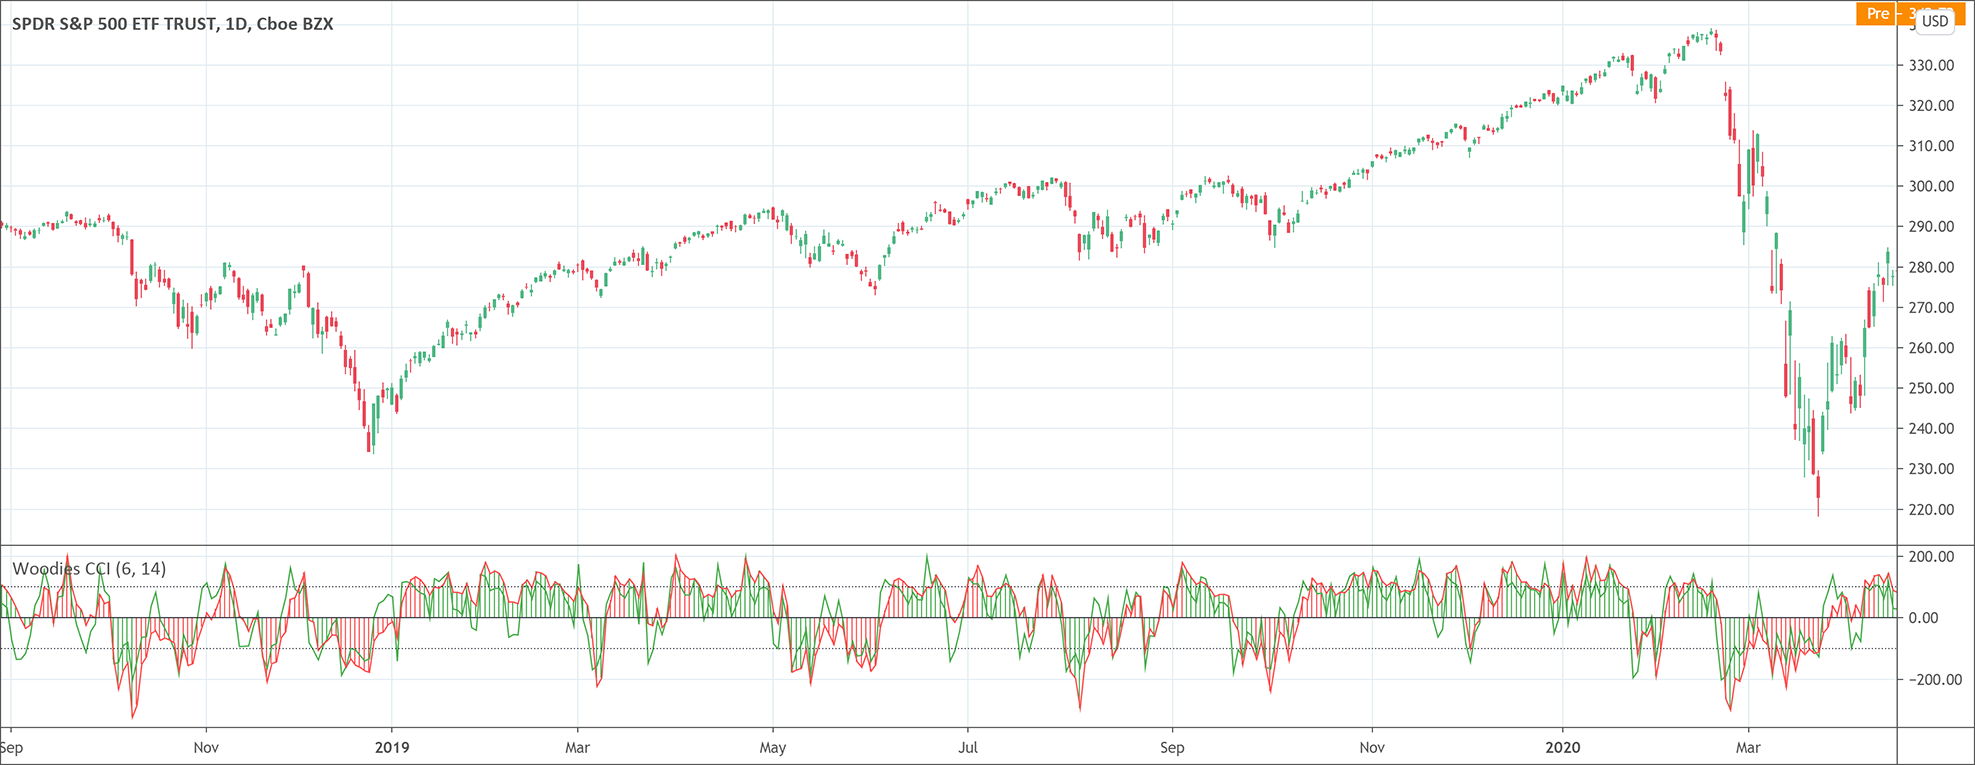
The Woodies CCI indicator is designed to help traders identify turning points. It is a complete system with predefined rules. The Woodies CCI indicator is a technical analysis tools popular … Read more
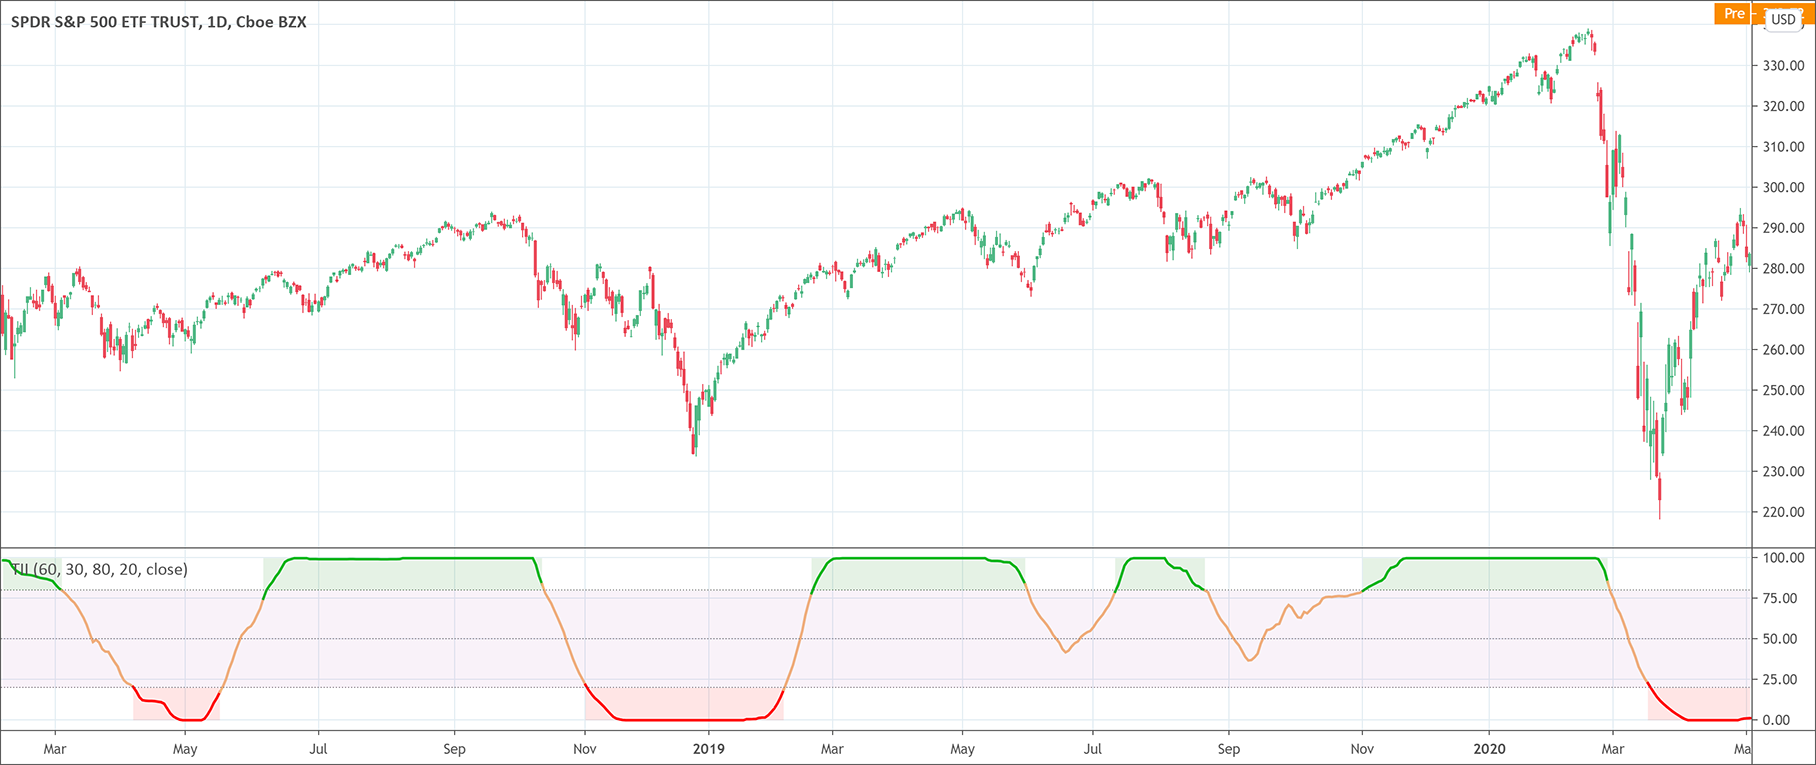
The Trend intensity index (TII) indicator measures the strength of a trend in the market. It compares the price of the last 30 days to the 60-day moving average. M.H. … Read more
We research technical analysis patterns so you know exactly what works well for your favorite markets.
© PatternsWizard | Crafted with care by traders for traders
Trading is not appropriate for all investors, and the risks can be substantial. You agree and acknowledge further that the trading signals and contents provided to you by PatternsWizard are not, and are not intended to be, an offer or solicitation to enter into any transaction, or any type of trading or investment advice, recommendation or strategy. You acknowledge that it is solely your decision to determine which, if any, PatternsWizard trading signals and contents to use for trading (whether actual or simulated). Statistics provided are the result of backtests and are provided as is with no guarantee. Past performance is no guarantee of future results. Trading PatternsWizard signals may result in losses. Leverage can work against you as well as for you, and can lead to large losses as well as gains. You should only trade with funds that you can afford to lose. Based on the foregoing, you agree that you shall not seek to hold PatternsWizard, its managers or its developpers responsible for any losses associated with any trading signals or contents provided to you by PatternsWizard. CFDs are complex instruments and come with a high risk of losing money rapidly due to leverage. Between 74-89 % of retail investor accounts lose money when trading CFDs. You should consider whether you understand how CFDs work and whether you can afford to take the high risk of losing your money. PatternsWizard is for education purposes only.
Some of the links in this site are affiliate links. It means these websites will pay us a small commission at no additional cost to you if you buy from them.
PatternsWizard is NOT FINANCIAL ADVICE, trade responsibly.